
By Chris Horymski
Consumers accumulated an additional $73 billion in debt over the past year through the second quarter (Q2) of 2023, according to Experian data. Debt balances have risen for most types of consumer debt, resulting in a 4.5% total increase since Q2 2022. Collectively, consumers now owe $16.84 trillion to lenders.
In this midyear review of consumer debt, Experian examined representative and anonymized credit data from Q2 2022 through Q2 2023, and highlighted some of the observations. The data revealed that each type of debt told a slightly different tale about the state of the economy in 2023. Some types of debt are growing spectacularly, while others are more subdued—although not every segment of the consumer population has seen an equal impact.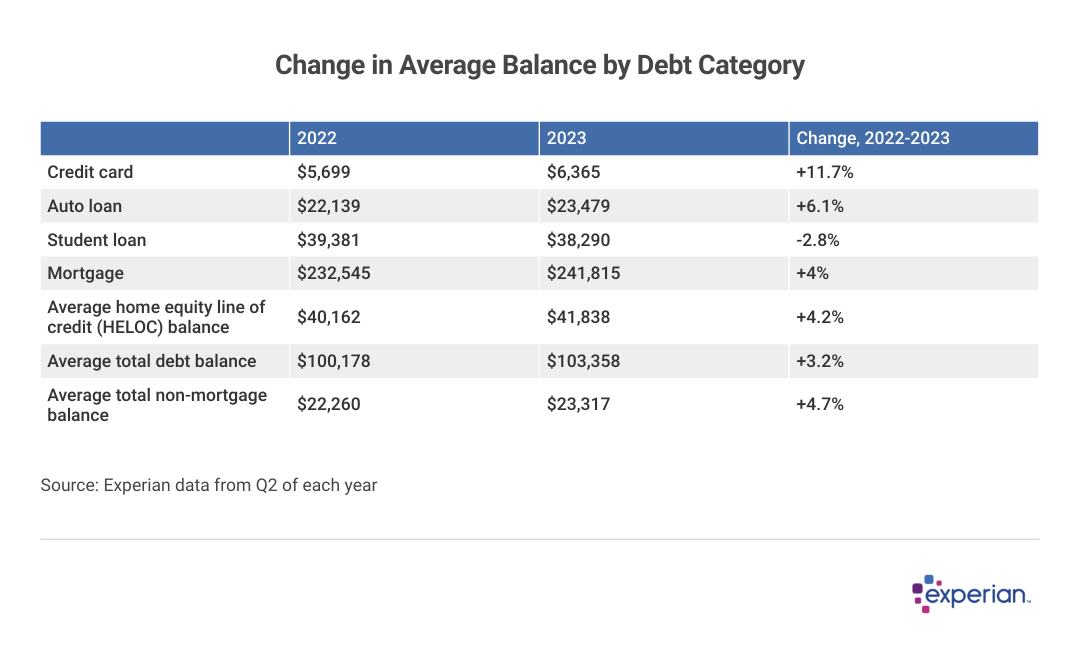
Experian
Changes in average consumer credit balances vary by type of debt
The total debt balance appearing in consumer credit files increased to $16.84 trillion as of Q2 2023, up from $16.11 trillion in Q2 2022. This was a smaller increase than the 7% jump in consumer debt from Q2 2021 to Q2 2022.
Average consumer debt balances increased in 2023, though growth has slowed compared to prior years.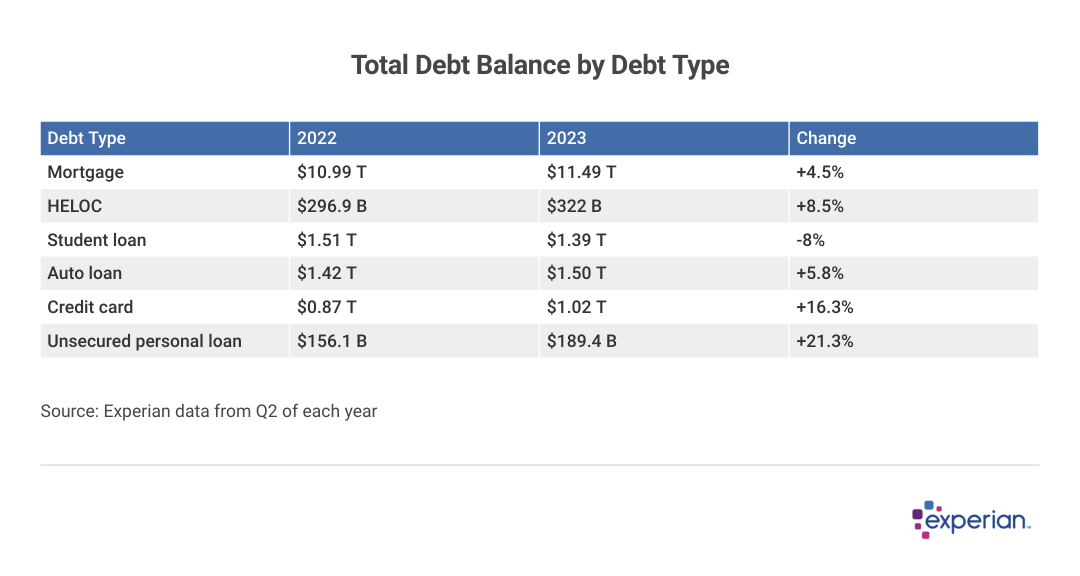
Experian
Mortgage debt looms largest, but personal loan debt saw the biggest growth
In percentage terms, credit card and personal loan debt grew the most in 2023, increasing by 16.3% and 21.3%, respectively. The “percentage terms” qualifier is important here: Despite the double-digit percentage growth, the $150 billion increase in credit card and personal loan debt is still dwarfed in dollar terms by the $500 billion sum added to the total consumer mortgage balance.
The total auto loan balance increased 5.8% to $1.5 trillion for the 12 months ending in Q2 2023, according to Experian data. While not as sharp an increase as was seen with personal loans and credit cards, drivers are still reeling from years of inventory shortages that increased prices for both new and used vehicles. In addition, expenses not directly tied to financing (auto insurance, for example) are also eating into driving costs. This effect is so pronounced that higher auto loan APRs, currently averaging 7.50% according to Federal Reserve data, may only be a secondary concern for some car buyers in 2023.
Student loans declined by $120 billion in 2023, a stark contrast to the other types of debt. Factors contributing to the decrease in student debt levels included the moratorium on interest assessed on student loans, some borrowers making loan payments during the three-year payment pause that ended this year, and loan forgiveness initiatives through the Department of Education.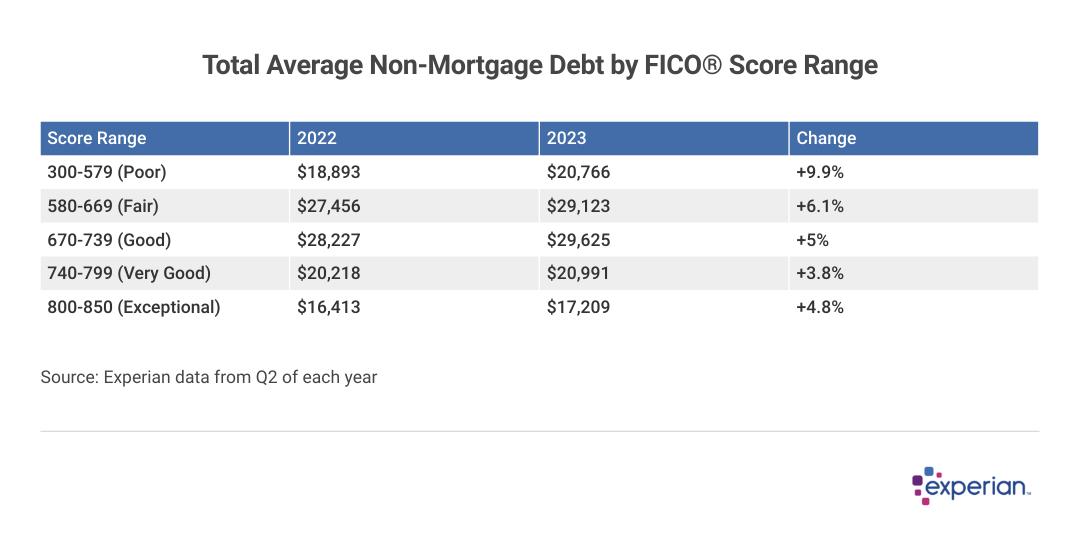
Experian
Average debt increases more sharply among those with lower credit scores
Those with lower FICO Scores tend to carry higher balances, on average, while those with very good or exceptional scores saw their average balance increase at more modest rates in 2023. Although larger balances in and of themselves don’t automatically translate to lower credit scores, consumers with lower FICO Scores don’t often receive as favorable interest rates on their loans and credit. Higher interest rates on debt means balances will swell faster (in the case of revolving credit like credit cards) as well as take longer to pay down (in the case of fixed debt like auto loans).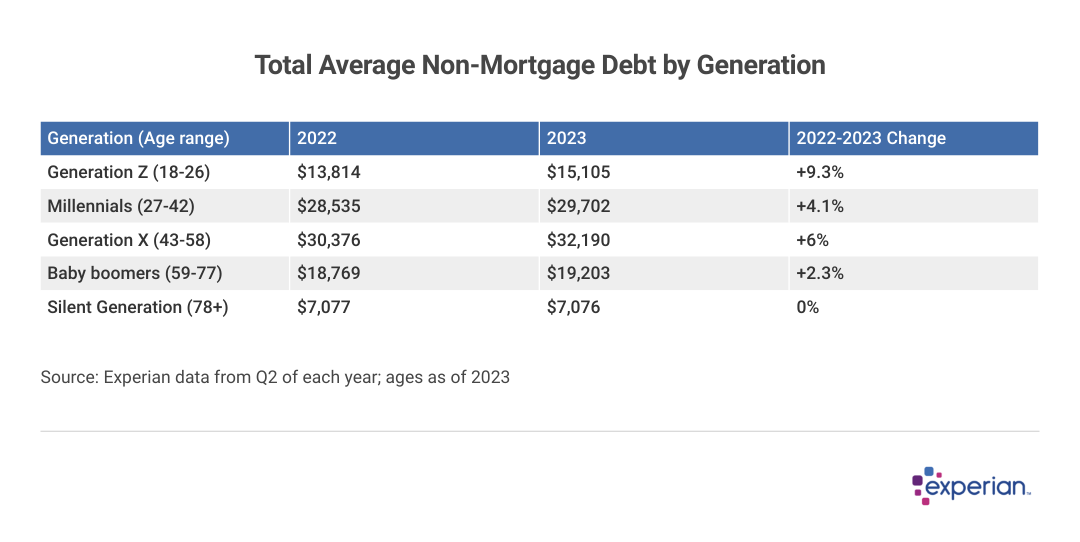
Experian
Generation X leads in non-mortgage debt growth
Average overall debt, excluding mortgage debt, increased among all except the oldest U.S. consumers in 2023. But one generation carrying much of the higher debt costs is Generation X. Now at least in their mid 40s, Generation X’s nearly $2,000 increase in average non-mortgage debt was significantly more, in dollar amount terms, than the increases of the other generations. In addition, Generation X, along with millennials, carry the majority of student loans.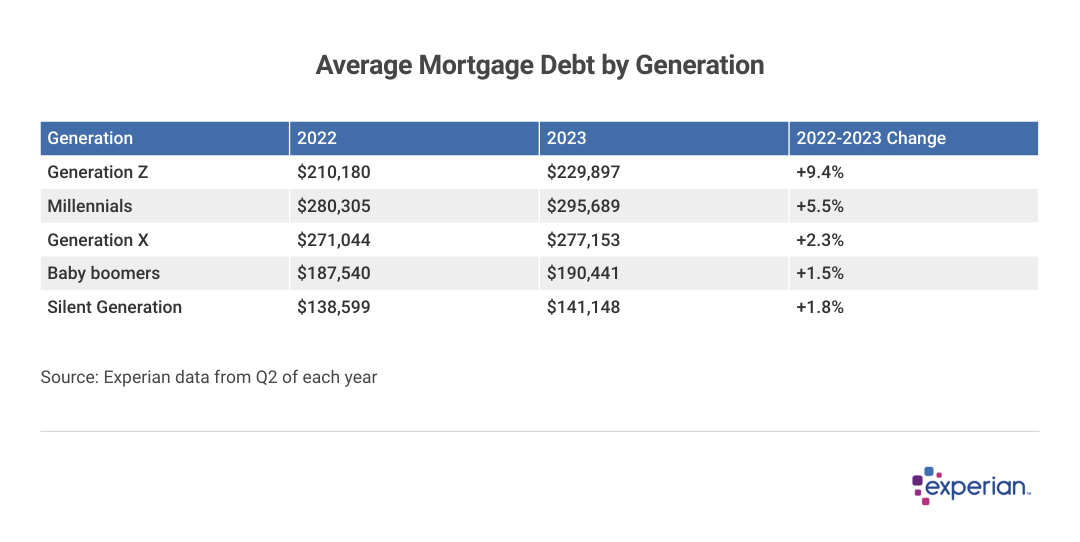
Experian
Mortgage debt increases at slower rate than other types of debt
Except for the newbie Generation Z homeowners, mortgage balances increased less than other types of consumer debt over the past 12 months. This makes sense when you consider two factors: the preponderance of existing mortgages with interest rates of 4% or less, and the relative scarcity of new mortgage originations at now eye-watering rates of more than 7% (for 30-year fixed rate mortgages).
Until home sales, and perhaps more important, the number of homes for sale, increase, expect the modest mortgage debt increases to continue. While good news for existing homeowners—especially those with low mortgage interest payments as well as appreciating home values—sluggish growth means many consumers wanting to buy will likely remain on the sidelines.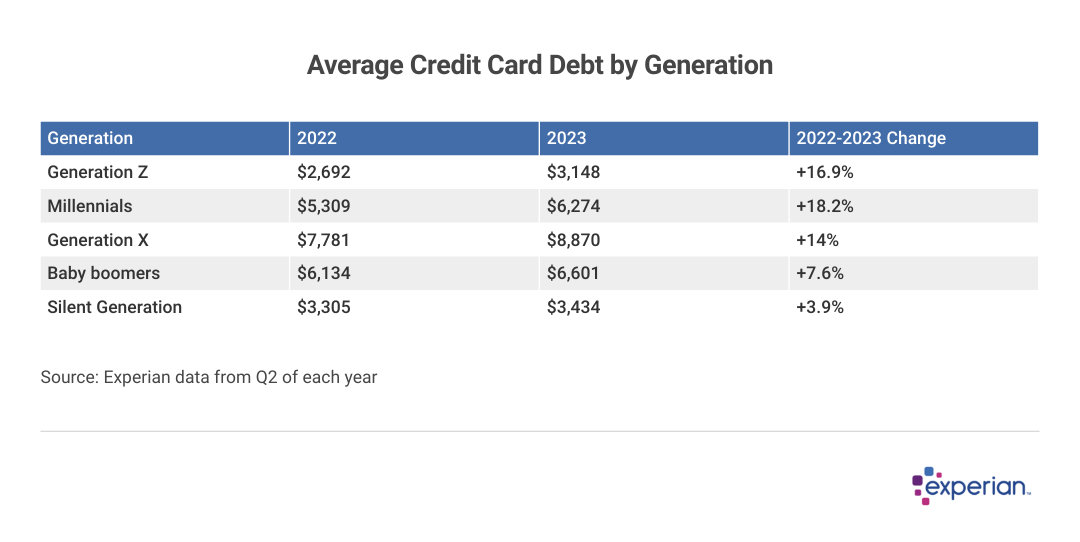
Experian
Millennials hardest hit by credit card debt increases
Credit card balances grew by 16.3% for all U.S. consumers over the past year, with the average balances among younger consumers—Generation Z and millennials—growing even faster than the overall increase.
Average credit card balances for every generation outstripped the 3% increase of the consumer price index over that same period. Consumers, facing sharp increases in the prices of many of the basics—food costs were up 5.7% and rents up 8.5%, according to the Bureau of Labor Statistics—may be adding to credit card balances by borrowing for more discretionary purchases, such as travel and entertainment.
While the increases are perhaps eyebrow-raising, consider that more consumers are now considered creditworthy enough for lenders to extend credit to them in the first place. Unemployment levels remain below 4%, which means more consumers are making an income, which is something lenders prefer to see before they’ll extend them credit.
But of course, that credit card use comes with the cost of rising APR for revolving balances, which have increased by an average of 5 percentage points since 2020. So although an increase in purchases and purchasing power are driving some of the credit card increase, higher interest rates are also an accelerant.
Where consumer debt levels may be headed in 2024
Overall, an observer probably shouldn’t expect a sharp increase in the total consumer debt levels in the next year, if only for one reason: Mortgages make up nearly two-thirds of the $16 trillion debt level, and those debt balances are growing the least in percentage terms, as both new and potential homeowners shy away from 7% mortgage rates, creating very new additional mortgage debt.
However, the growth rates of other types of debt for the coming months are difficult to anticipate. Changes in credit card debt balances will largely be a function of holiday spending, as always. Consumers may have the income to spend, yet may balk at adding even more interest-bearing purchases to their existing debt levels.
Predicting auto loan debt levels will depend on how much inventories are being roiled again, this time by strikes at some U.S. auto plants this fall. Even student loans, where payments have recently resumed after a three-year absence, are difficult to forecast, as borrowers and loan servicers navigate new student loan repayment plans available to federal student loan borrowers.
The following indicators will directly inform how much consumer credit balances will increase as we approach 2024:
- Wages: Price increases on consumer goods outpaced wage increases in 2021 and 2022, and median incomes, after adjusting for inflation, have fallen over the past two years. Moreover, the decline was most pronounced for those with incomes below the median, so those earning the least fell furthest behind. However, unemployment remains low. Additionally, so far this year, workers have demanded—and in many cases, received—pay increases from employers, who still have many more potential job openings to fill than workers to fill them. In short, higher wages and nearly full employment will likely encourage consumers to spend more, even in the face of higher rates.
- Unemployment claims: Typically, increases in unemployment and economic slowdowns only start occurring when more than 300,000 workers weekly start a new unemployment claim. So far in 2023, claims have been well under that level, according to Labor Department data. If the trend continues, then there’s at least the chance that there will be more consumers with more discretionary income to spend.
- Holiday spending: We’re already receiving mixed messages about the holiday season from employers. Some, like Amazon, expect to hire more seasonal workers this holiday season, while retailers like Macy’s aren’t hiring as many in 2023 versus the prior holiday season. While this information may be telling us more about how consumers might spend rather than if consumers might spend, conflicting economic signals are par for the course in 2023.
With all that noted, there are still enough wild cards that could upend any reasonable short-term economic forecast, and we’ve already seen pandemics and international conflicts impact the cost of nearly everything so far this decade, including credit. One constant for consumers remains, though: Access to credit still depends in large part on a consumer’s credit history.
Methodology: The analysis results provided are based on an Experian-created statistically relevant aggregate sampling of our consumer credit database that may include use of the FICO Score 8 version. Different sampling parameters may generate different findings compared with other similar analysis. Analyzed credit data did not contain personal identification information. Metro areas group counties and cities into specific geographic areas for population censuses and compilations of related statistical data.
This story was produced by Experian and reviewed and distributed by Stacker Media.
Re-published with CC BY-NC 4.0 License.