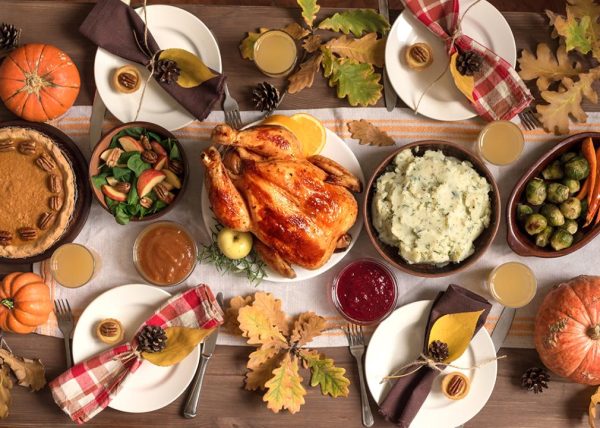
As the air turns crisp and the anticipation of holiday gatherings begins, it’s time to rediscover the foods and festivities that define the season. According to a recent Instacart survey of over 2,000 U.S. adults by The Harris Poll, a hearty 89% plan to celebrate Thanksgiving.
This report explores the trends surrounding Thanksgiving using Instacart purchase data from the 2023 holiday season as well as a recent Harris Poll survey. The festive findings include the most and least popular Thanksgiving dishes, food preferences by region and favorite holiday beverages.
Thanksgiving trends unveiled
Thanksgiving grocery shopping and preparation is all about timing. For Instacart customers, the day before the holiday marked the peak for orders, including staple ingredients. However, purchase data from 2023 showed that turkey orders peaked four days before the big day, giving savvy planners ample time for the birds to thaw. Data also showed the classic duo of turkey and cranberry sauce was top-of-mind for consumers, as the top five Thanksgiving-focused items included whole turkey, cranberries, whole frozen turkey, pumpkin pie and canned cranberries.

Cooking up a storm
Cooking duties this year are a shared affair. While 64% of women plan to prepare at least one dish, 57% of men are also taking up the culinary challenge and contributing at least one dish. Equal proportions — 30% of men and 30% of women — plan to cook the entire feast.
Thanksgiving celebrations will also look a bit different this year from generation to generation:
- Gen X (ages 44-59) are more likely than Gen Z (ages 18-27) or Boomers (ages 60-78) to assume the role of Thanksgiving hosts (42% vs. 32% each), while Gen Z (66%) and millennials (59%) will fill seats as enthusiastic attendees (vs. 41% Gen X and 43% Boomers).
- Gen Z (92%) and millennials (91%) are more likely than Boomers (86%) to celebrate Thanksgiving, while Boomers (14%) are more likely to skip the festivities this year than Gen Z and millennials.
- Gen Z (63%), millennials (66%), and Gen X (61%) are all leading Boomers (53%) in planning to cook or prepare food contributions.
How long is too long in the kitchen?
Thanksgiving preparations are no walk in the park, with 62% of those participating in preparing dishes investing four or more hours in prep time. Interestingly, more men (66%) than women (59%) plan to spend four or more hours preparing dishes for Thanksgiving.
Regional contrasts reveal that folks in the Northeast are more likely than those in the West or South to spend less time cooking, with 45% planning a brisk one- to three-hour prep versus 31% in the West and 34% in the South. Meanwhile, those in the West are more likely than those in the Northeast to hunker down for the long haul, with half of home cooks in the region planning to cook for four to six hours (50% vs. 37%). Notably, 10% in the South are ready to engage in marathon 10-hour plus culinary sessions.
Cheers to that!
According to the survey, 53% of those age 21+ celebrating Thanksgiving this year plan to indulge in alcoholic beverages and 8% will opt for nonalcoholic beer or wine with dinner. Instacart purchase data confirms that nonalcoholic drink purchases are on the rise: Between 2019 and 2023, alcohol orders that included nonalcoholic drinks jumped by 157% during the week leading up to Thanksgiving. This shift likely mirrors the growing popularity of the “sober curious” movement, as more people seek out ways to celebrate without alcohol.

The generational divide: Mac and cheese vs. stuffing
Tradition reigns supreme when it comes to Thanksgiving, with three in four Americans planning to celebrate Thanksgiving (75%) preferring traditional dishes. However, there are generational differences on what dishes are considered fan favorites — Gen Z shows an affinity for macaroni and cheese (63%) and mashed potatoes (67%), ranking these dishes among their favorites, while Boomers are most likely to rank macaroni and cheese among their least favorites (27%).
On the other hand, the Boomer generation is quite fond of stuffing (76%) and mashed potatoes (69%), ranking the comfort foods among their top favorites, while Gen Z is most likely to rank stuffing as their least favorite (21%). This difference in opinion might indicate a shift in what future generations may view as a Thanksgiving must-have for their dinner spread.
Turkey takes top spot
Though many claim Thanksgiving is “all about the sides,” the survey insights show people like to come for the main event. Turkey is the most popular Thanksgiving dish for 74% of Americans, with mashed potatoes (67%) and stuffing (64%) securing second and third places, respectively. Sadly for cranberry fans, cranberry sauce is the No. 1 least favorite dish for over a quarter of Americans (27%).
Here are the top five most popular and least popular Thanksgiving sides, according to this survey:

Polarizing sides or regional delights?
Culinary preferences — especially among some of the least favorite dishes nationally — vary in popularity from region to region.
Apple pie is most favored in the Northeast, with 50% listing the dish as their top favorite compared with 42% in the South and 39% in the Midwest and West. And while pecan pie was tied for one of the least favorite Thanksgiving dishes across the country, it finds an enclave of support in the South, with 40% wanting to add it to their dessert plate compared with 24% in the Northeast, 26% in the Midwest and 27% in the West.
Green bean casserole is a favorite for both Southerners and Midwesterners, with 43% of each group ranking it as one of their top dishes. Westerners, perhaps leaning into their health-conscious reputation, are more likely than those in the Midwest (36% vs. 29%) to consider salad one of their favorite Thanksgiving sides.
Not only are there regional preferences about which foods are served for Thanksgiving, there are also regional preferences about how those foods are prepared. Instacart looked at how many orders with sweet potatoes also included marshmallows, which could indicate a preference for candied yams with marshmallows.
Here are the top five states with the most orders for sweet potatoes and marshmallows in the same cart, based on 2023 purchase data:
- Wyoming
- West Virginia
- Kansas
- Arkansas
- Missouri
While candied yams with marshmallows is a quintessentially Southern-inspired dish, 2023 purchase data shows the possible appeal of this side across the country, resonating deeply across the Great Plains, Rocky Mountains and South.

Regional flavors and holiday traditions shape Thanksgiving plans
Regional preferences help shape holiday meals — whether it’s the Northeast’s preference for apple pie or the South’s love for green bean casserole. These patterns not only reveal the diverse culinary landscapes across the country but also offer valuable insights for retailers and consumers alike, showcasing the unique tastes that define Americans’ holiday experiences.
Family, football and festivities: Thanksgiving isn’t just about food; it’s also about family. A heartfelt 69% plan to spend time with loved ones, with women (75%) leading the embrace of togetherness over men (64%). For many, the holiday isn’t complete without gridiron action — 58% plan to watch TV, with 62% of those focusing on football. This is closely followed by 47% of Thanksgiving TV viewers who plan to watch a Thanksgiving Day parade.
Easy as pie
Across the country, folks were flocking to pre-made pies to enjoy on Turkey Day. According to Instacart data from 2023, purchases for ready-made pies topped the list in:
- Wyoming
- West Virginia
- New Mexico
- Alaska
- Kentucky

South serves up more from-scratch pies
It’s possible that Southern neighbors were more inclined to prepare a scratch-made offering, as orders for pie crusts and fillings topped the charts in:
- Mississippi
- Arkansas
- North Carolina
- West Virginia
- Missouri

West Virginians united by their love of pie
Take me home, country roads. West Virginians ranked in the top five for each pie category, indicating a broad love for pies, no matter how they’re made.
Survey method
This survey was conducted online within the United States by The Harris Poll on behalf of Instacart from Sept. 19-23, among 2,077 adults ages 18 and older. The sampling precision of Harris online polls is measured by using a Bayesian credible interval. For this study, the sample data is accurate to within +/- 2.5 percentage points using a 95% confidence level.
Written by Alex Orellana.
This story was produced by Instacart and reviewed and distributed by Stacker. The article was copy edited and retitled from its original version.
Re-published with CC BY-NC 4.0 License.


