
Apple pie has long been a staple of American culture. However, a recent survey by Hers on Americans’ favorite pie for Thanksgiving found that 77% of respondents call a variety other than apple pie as their go-to. So, are people still “as American as apple pie?”
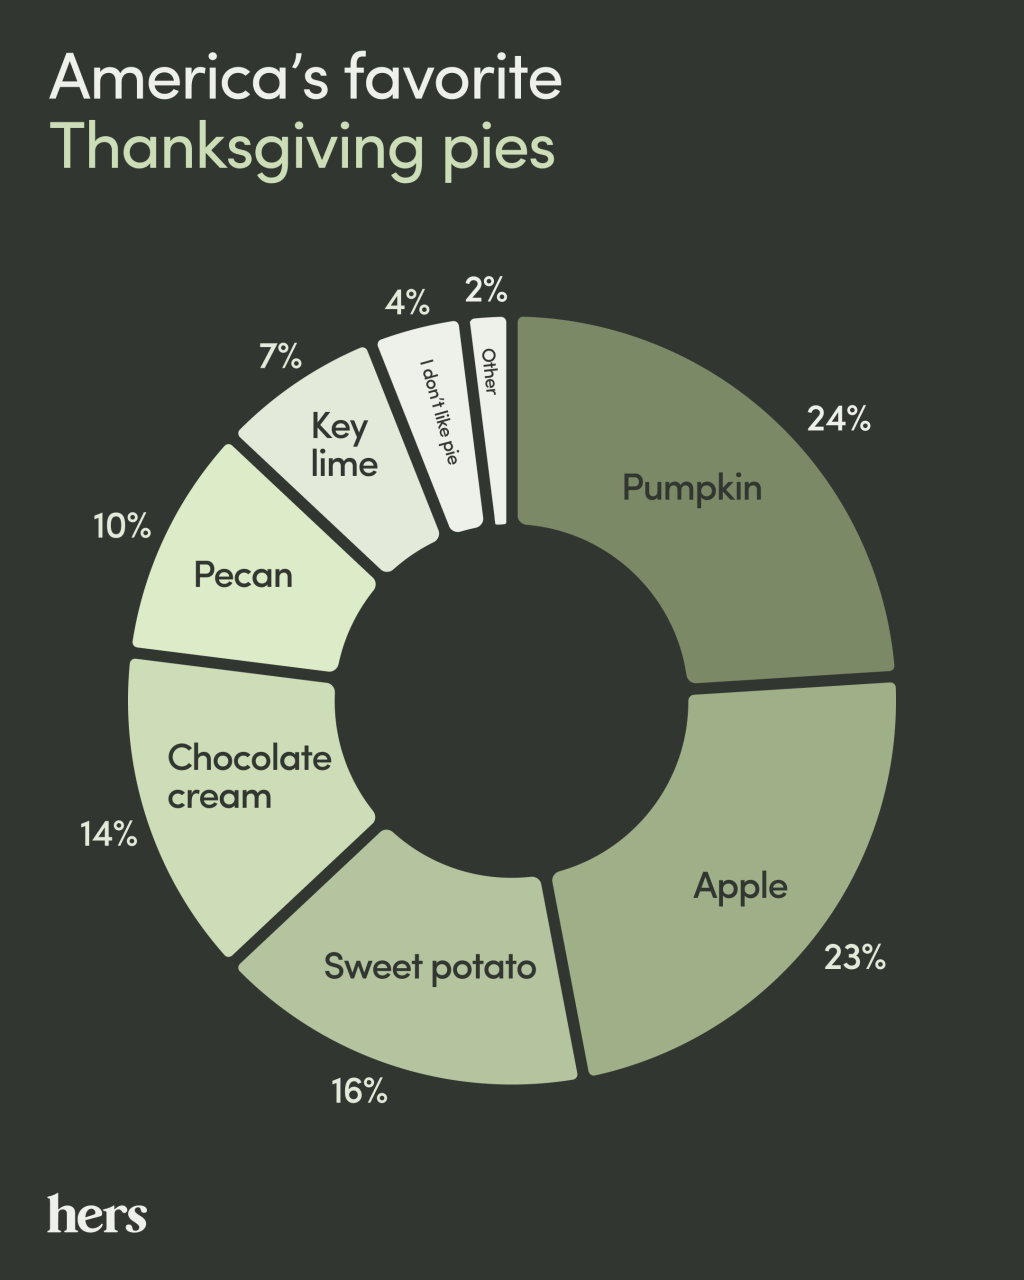
As for the overall pie winner, pumpkin takes the cake — errr, pie — beating apple pie as America’s favorite by a narrow margin, 24% versus 23%. Sweet potato pie, chocolate cream pie, pecan pie and key lime pie rounded out the list of top pies, see the American Pie Chart below. Also notable, though, is that pie preference varies greatly by region.
The state of pie in America
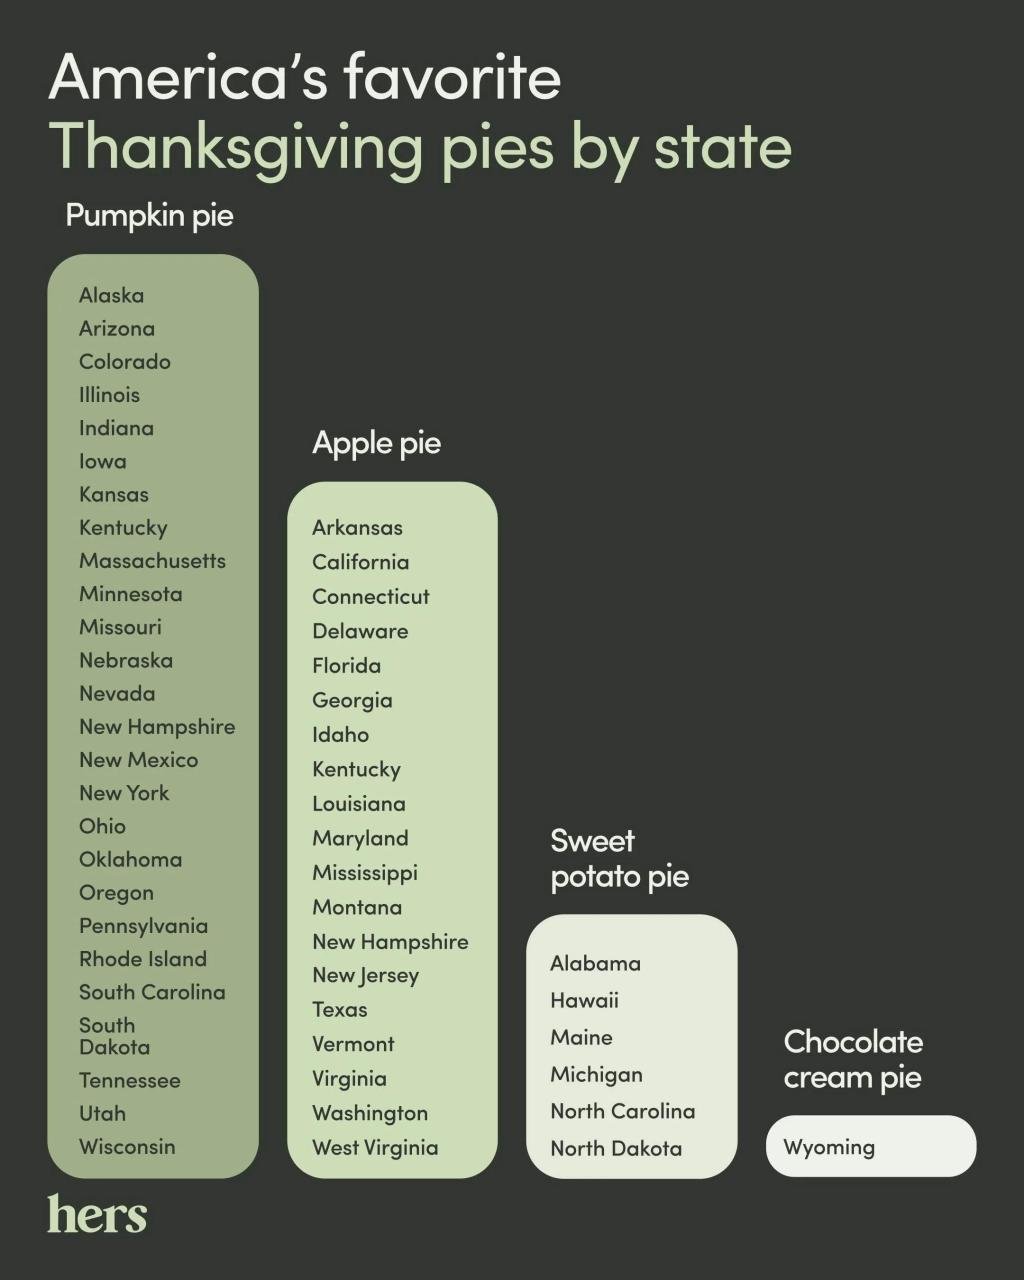
While generational differences play a role in pie preference — notably, baby boomers are 50% more likely than members of Gen Z to name pumpkin pie as their favorite — 30% versus 20% — geography is the biggest indicator of which pie is most likely to end up on your Thanksgiving table. Here are the five biggest regional differences in pie preference, along with the top pie in every state, see the graphic below on favorite Thanksgiving pies by state.
1. Most ‘American as apple pie’: Delaware
Delaware has the highest percentage of apple pie lovers in America, with 35% naming the variety as their favorite — Idaho came in second place, 34%, followed by Montana at 33%. Comparatively, just 23% of Americans overall named apple pie as their favorite.
Within much of the Mid-Atlantic region and New England, apple pie holds strong, tying back to the region’s historic orchards and colonial roots. Virginia, Maryland, New Jersey, New Hampshire, and Vermont are also all apple pie lovers.
What does Delaware not love? Pumpkin pie. Only 15% name pumpkin as their favorite Thanksgiving pie, placing the state second for pumpkin pie lovers. Alabama was last with only 9% naming pumpkin as their top pie.
2. Biggest pie lovers: Mississippi
Fewer than 1%, 0.9%, of people from Mississippi say they don’t like pie, making it the state with the highest percentage of pie lovers in America. Overall, 4% of Americans indicate they don’t like pie on Thanksgiving, with Iowa having the highest percentage of non-pie lovers at 8%.
So what’s Mississippi’s favorite pie? The population is torn. About the same percentage of Mississippians like apple pie, 21%, as do pumpkin pie, 20%, sweet potato pie, 19%, and chocolate cream pie at 18%, highlighting their diverse pie palate.
3. Most counterculture about pie: North Dakota
North Dakota stands out for a few reasons regarding pie results: It’s the state with residents least likely to name apple pie as a favorite, 15% for the state versus 23% overall for Americans.
People from North Dakota are also most likely to love pecan pie, 18% say it’s a favorite, which falls relatively low on America’s favorite pie list — just 10% overall call it a favorite. The state’s favorite pie overall is sweet potato pie at 22%.
Notably, North Dakota’s southern sister state South Dakota, has a similar pie profile. South Dakota residents have a strong preference for pecan pie and relatively low interest in apple pie. But the state similarities stop with sweet potato pie, which South Dakota ranks as second to last.
4. Biggest regional surprise: Wyoming
Though being home to the Florida Keys, only 6% of Floridians named key lime pie as their favorite, which is below the national average. Surprisingly, Wyoming had the highest percentage of people who named key lime pie as their favorite for Thanksgiving.
Furthermore, more than twice as many people from Wyoming say key lime pie is their favorite compared to Americans overall, 15% versus 7%. Wyoming is also the only state in the U.S. where chocolate cream pie tops its Thanksgiving pie list.
5. A tale of two pies: Tennessee
Nashville and Memphis are just three hours away from each other, but their pie preferences couldn’t be more different. In Nashville, it’s all about apple pie, with 31% of respondents naming it as their favorite Thanksgiving pie.
In Memphis, however, half as many name apple as a favorite, 17%. Instead, Memphis residents favor pumpkin pie, with 35% naming it as their top pie, which is the second-highest rate of pumpkin pie lovers of any city in the U.S. Minneapolis has the most pumpkin pie fans. Nashville, on the other hand, isn’t as into pumpkin pie, with only 18% saying it’s their top pie.
Favorites aside, nearly all of America loves Thanksgiving pie. While we may not agree on football, politics, or which Taylor Swift album is the best, 96% of Americans agree that pie is awesome. And for the 4% that don’t like pie — who are you people? America is as American as all the pies.
How to leave room for pie this Thanksgiving
If you are looking to trim back this Thanksgiving, but you still want to leave room for the most important course — pie — here are some suggestions on how you can have your pie and eat it, too.
1. Make healthier sides
Save room for pie by switching out a few ingredients in your favorite sides. You can make stuffing less … stuffing, up your veggie profile, and reserve the sweet stuff for the pie — looking at you, canned cranberries.
2. Eat clean before the big say
Take a proactive approach and follow a cleaner diet the week prior to Thanksgiving. Skip the sweets and cocktails, load up on fruits and veggies, drink lots of water and buy local, organic foods.
3. Take a trot
Start a new holiday tradition with a Thanksgiving Day hike, walk or ‘turkey trot.’ Find a race in your state, or just go on a leisurely walk with friends or family to burn some extra calories to help offset your pie.
Favorite Thanksgiving pie in every state
Only seven states left the pumpkin-or-apple pie trend, with six states choosing sweet potato pie as their Thanksgiving go-to: Alabama, Hawaii, Maine, Michigan, North Carolina and North Dakota, and one state — Wyoming — choosing chocolate cream.
- Alabama: Sweet potato pie
- Alaska: Pumpkin pie
- Arizona: Pumpkin pie
- Arkansas: Apple pie
- California: Apple pie
- Colorado: Pumpkin pie
- Connecticut: Apple pie
- Delaware: Apple pie
- Florida: Apple pie
- Georgia: Apple pie
- Hawai‘i: Sweet potato pie
- Idaho: Apple pie
- Illinois: Pumpkin pie
- Indiana: Pumpkin pie
- Iowa: Pumpkin pie
- Kansas: Pumpkin pie
- Kentucky: Apple pie, Pumpkin pie (tied)
- Louisiana: Apple pie
- Maine: Sweet potato pie
- Maryland: Apple pie
- Massachusetts: Pumpkin pie
- Michigan: Sweet potato pie
- Minnesota: Pumpkin pie
- Mississippi: Apple pie
- Missouri: Pumpkin pie
- Montana: Apple pie
- Nebraska: Pumpkin pie
- Nevada: Pumpkin pie
- New Hampshire: Apple pie, Pumpkin pie (tied)
- New Jersey: Apple pie
- New Mexico: Pumpkin pie
- New York: Pumpkin pie
- North Carolina: Sweet potato pie
- North Dakota: Sweet potato pie
- Ohio: Pumpkin pie
- Oklahoma: Pumpkin pie
- Oregon: Pumpkin pie
- Pennsylvania: Pumpkin pie
- Rhode Island: Pumpkin pie
- South Carolina: Pumpkin pie
- South Dakota: Pumpkin pie
- Tennessee: Pumpkin pie
- Texas: Apple pie
- Utah: Pumpkin pie
- Vermont: Apple pie
- Virginia: Apple pie
- Washington: Apple pie
- West Virginia: Apple pie
- Wisconsin: Pumpkin pie
- Wyoming: Chocolate cream pie
Data and methodology
Results come from an August 2025 online survey of 6,985 people. Participants include approximately 5,000 18-to-65-year-old respondents in the top 50 metropolitan areas totaling 100 respondents per city; 5,000 18-65-year-old respondents in each of the 50 states with 100 respondents per state; and a nationally representative sample of 500 18-to-65-year-old respondents to contextualize results. These three categories are not mutually exclusive, some respondents fall within more than one category.
Findings were analyzed by more than 150 demographic and psychographic cuts. These include city, region, self-identified gender, age, race and ethnicity, relationship status, parenting status, sexual orientation: heterosexual, bisexual, gay, lesbian, pansexual, asexual, queer, etc., fandoms such as music, sports, etc. and fitness and diet preferences, among other areas of interest.
All study data captured originate from this source, unless otherwise noted. The independent research firm Culture Co-op conducted and analyzed research and findings.
Written by Melissa Lavigne-Delville.
This story was produced by Hers and reviewed and distributed by Stacker. The article was copy edited from its original version.
Re-published with CC BY-NC 4.0 License.