The real estate frenzy spurred by the coronavirus pandemic continues, though at a slower pace. Buyers are still competing for a limited supply of housing, driving up prices for affordable properties in cities throughout Southern California.
The typical home value in the United States was $360,385 in October, 2.4% higher than the year before.
Increasing mortgage rates have slowed growth, with prices even declining in some places. But some areas are still seeing price jumps compared with the year before.
Stacker compiled a list of cities with the most expensive homes in the Los Angeles-Long Beach-Anaheim metro area using data from Zillow. Charts show the monthly typical home value since January 2018.
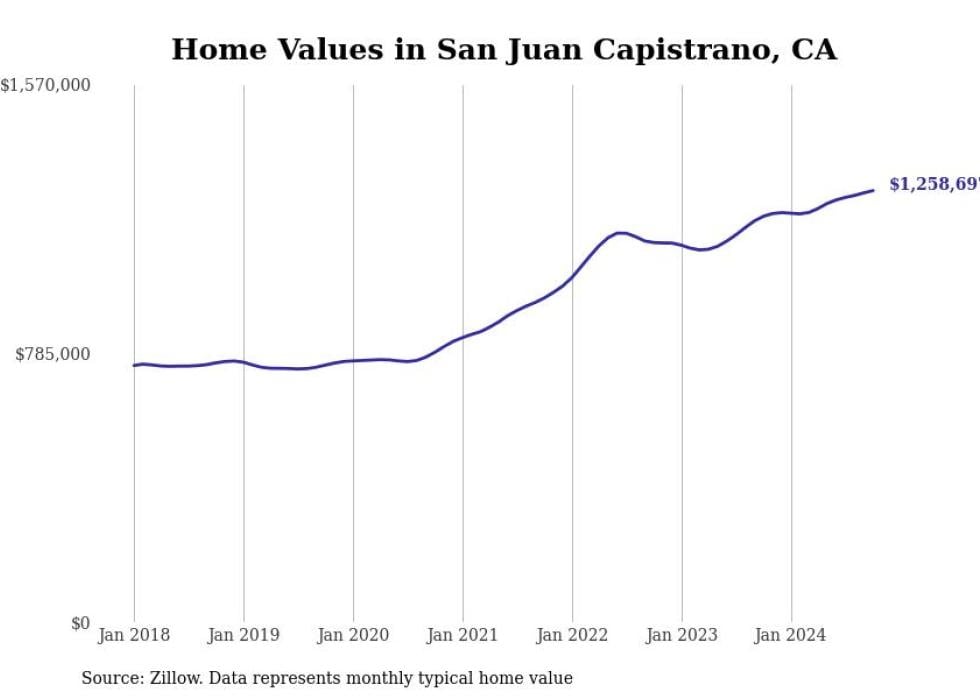
No. 30. San Juan Capistrano
1-year price change: +$74,907 (+6.3%)
5-year price change: +$508,970 (+67.9%)
Typical home value: $1,258,697 (No. 41 most expensive city in metro)
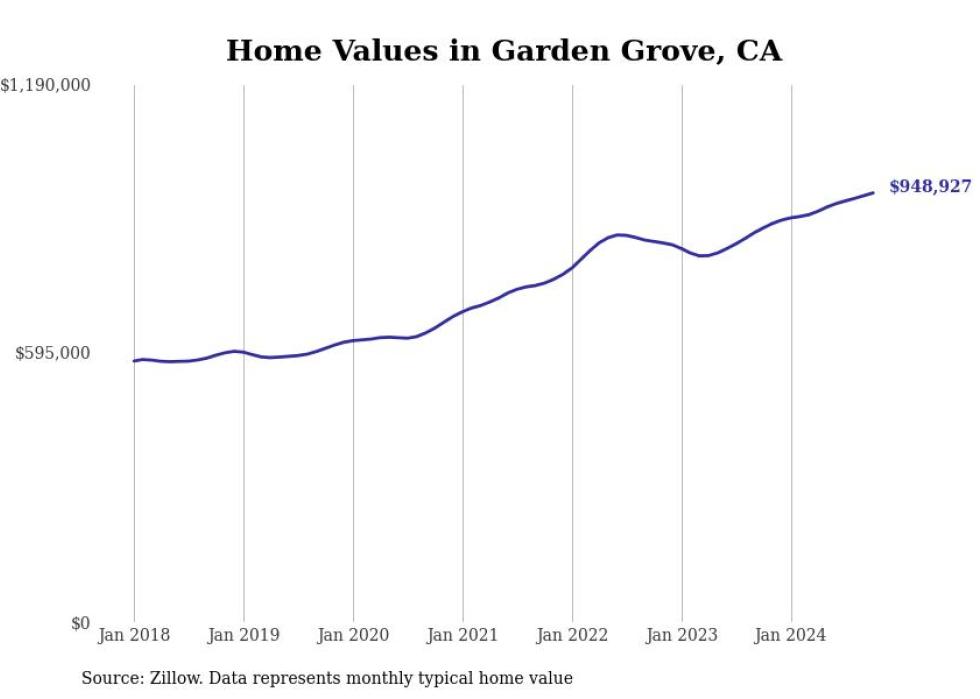
29. Garden Grove
1-year price change: +$77,340 (+8.9%)
5-year price change: +$343,663 (+56.8%)
Typical home value: $948,927 (73rd most expensive city in metro)
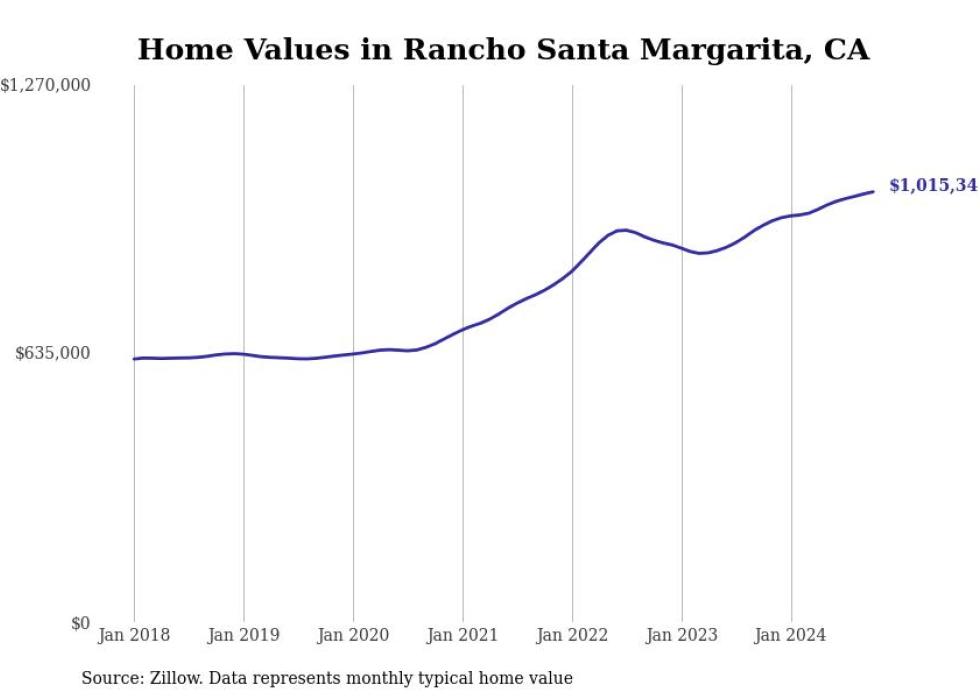
28. Rancho Santa Margarita
1-year price change: +$78,762 (+8.4%)
5-year price change: +$390,342 (+62.5%)
Typical home value: $1,015,341 (No. 65 most expensive city in metro)
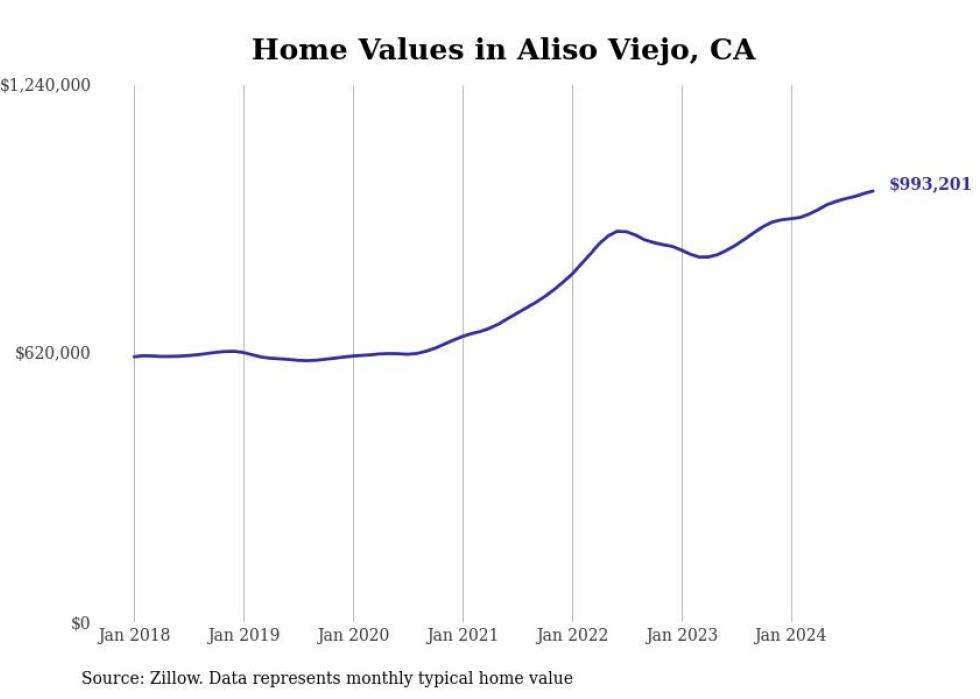
27. Aliso Viejo
1-year price change: +$81,662 (+9.0%)
5-year price change: +$387,668 (+64.0%)
Typical home value: $993,201 (No. 68 most expensive city in metro)
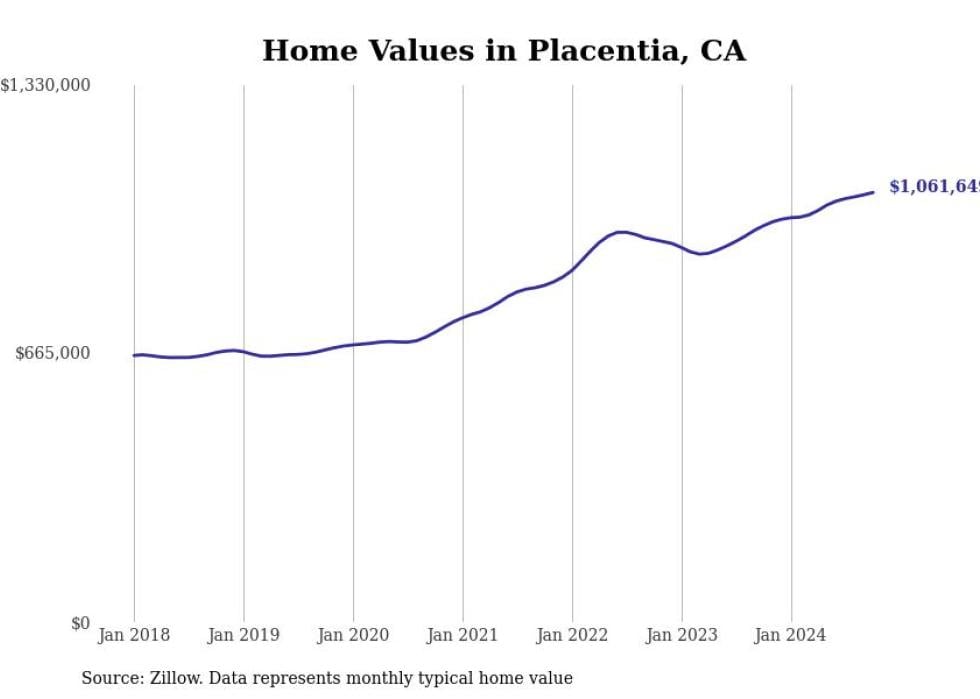
26. Placentia
1-year price change: +$82,304 (+8.4%)
5-year price change: +$388,869 (+57.8%)
Typical home value: $1,061,649 (61st most expensive city in metro)
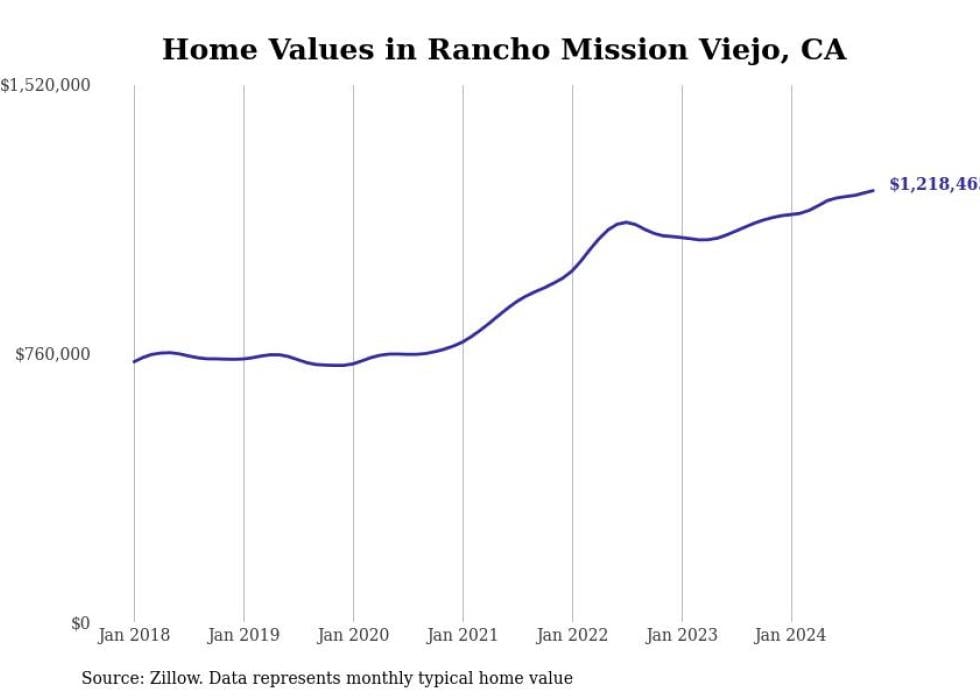
25. Rancho Mission Viejo
1-year price change: +$83,022 (+7.3%)
5-year price change: +$492,555 (+67.9%)
Typical home value: $1,218,465 (#45 most expensive city in metro)
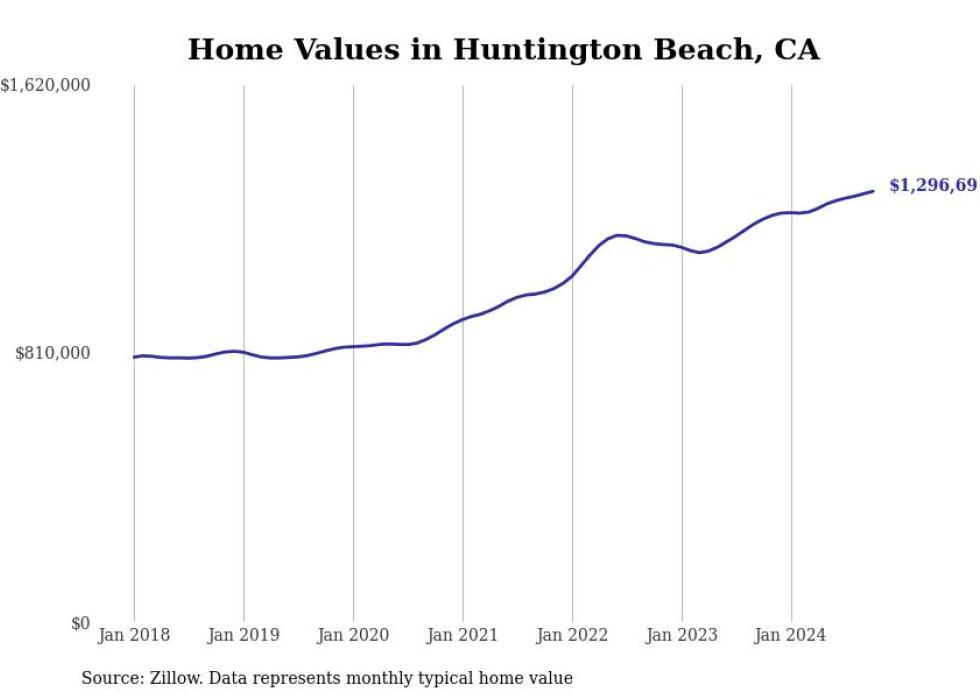
24. Huntington Beach
1-year price change: +$83,220 (+6.9%)
5-year price change: +$480,476 (+58.9%)
Typical home value: $1,296,691 (39th most expensive city in metro)
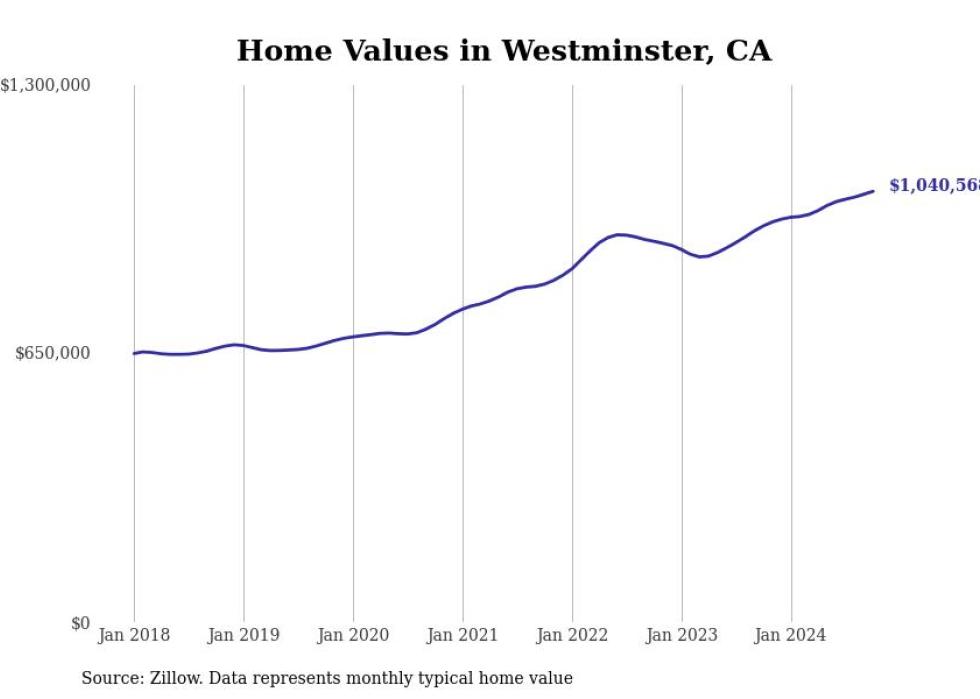
23. Westminster
1-year price change: +$83,619 (+8.7%)
5-year price change: +$367,028 (+54.5%)
Typical home value: $1,040,568 (No. 62 most expensive city in metro)
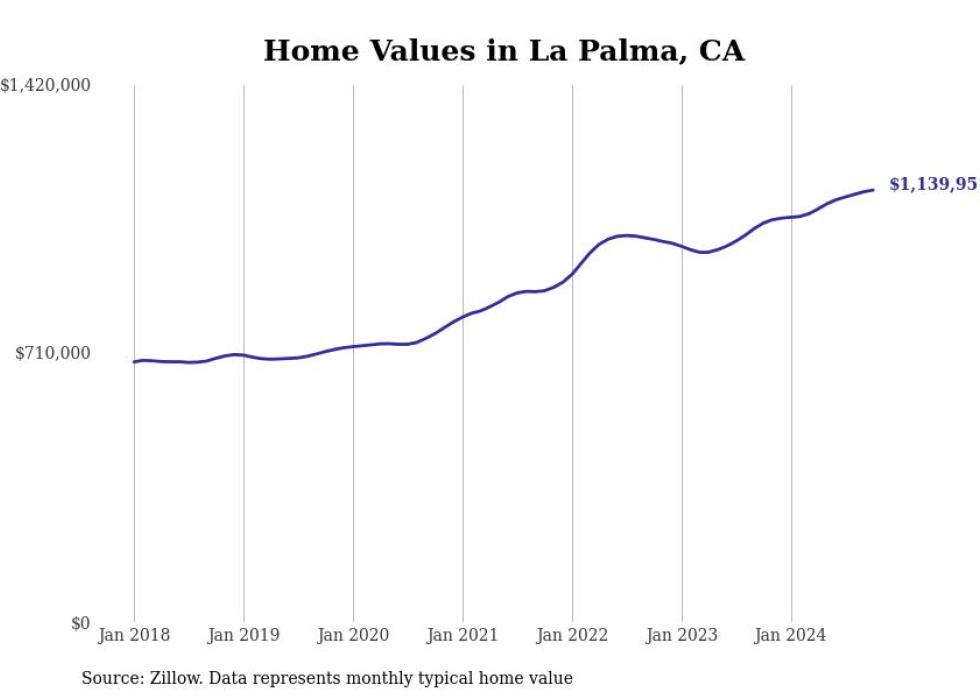
22. La Palma
1-year price change: +$87,229 (+8.3%)
5-year price change: +$426,269 (+59.7%)
Typical home value: $1,139,951 (54th most expensive city in metro)
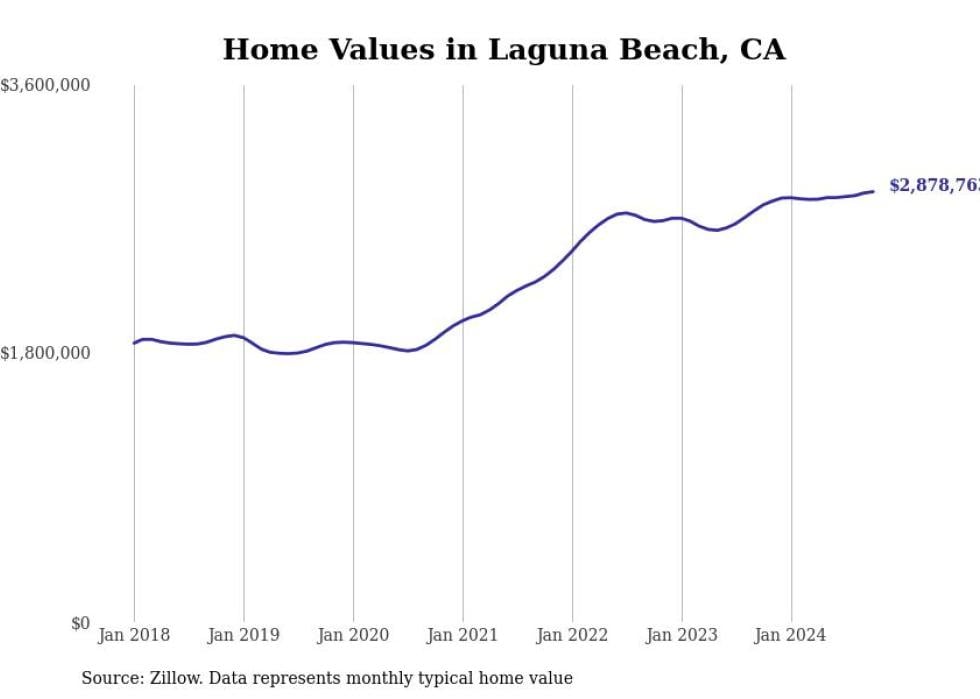
21. Laguna Beach
1-year price change: +$87,554 (+3.1%)
5-year price change: +$1,021,320 (+55.0%)
Typical home value: $2,878,763 (No. 7 most expensive city in metro)
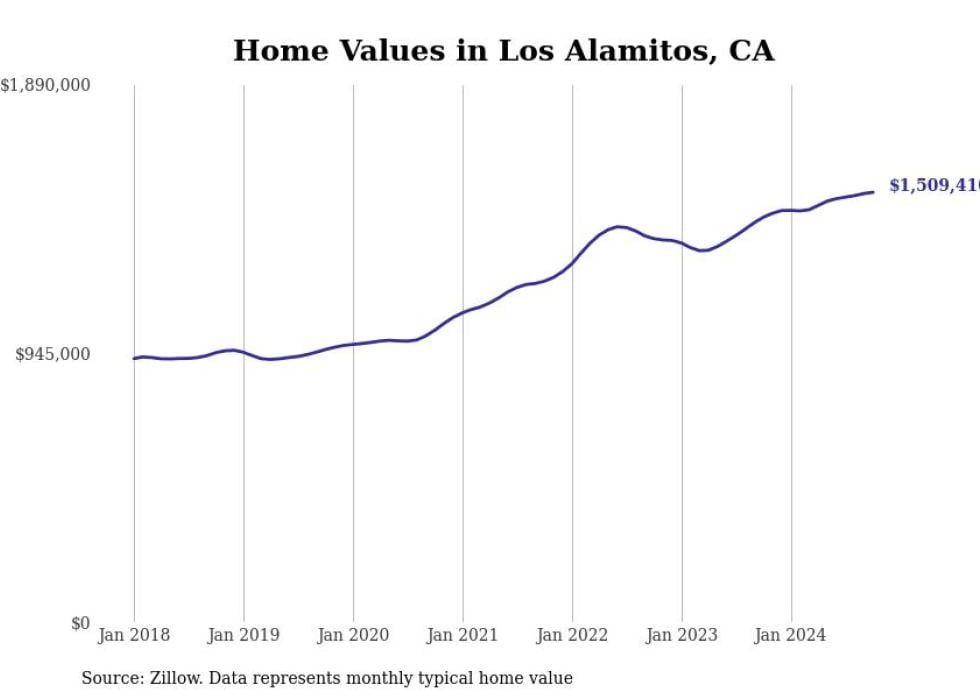
20. Los Alamitos
1-year price change: +$87,627 (+6.2%)
5-year price change: +$552,293 (+57.7%)
Typical home value: $1,509,410 (No. 27 most expensive city in metro)
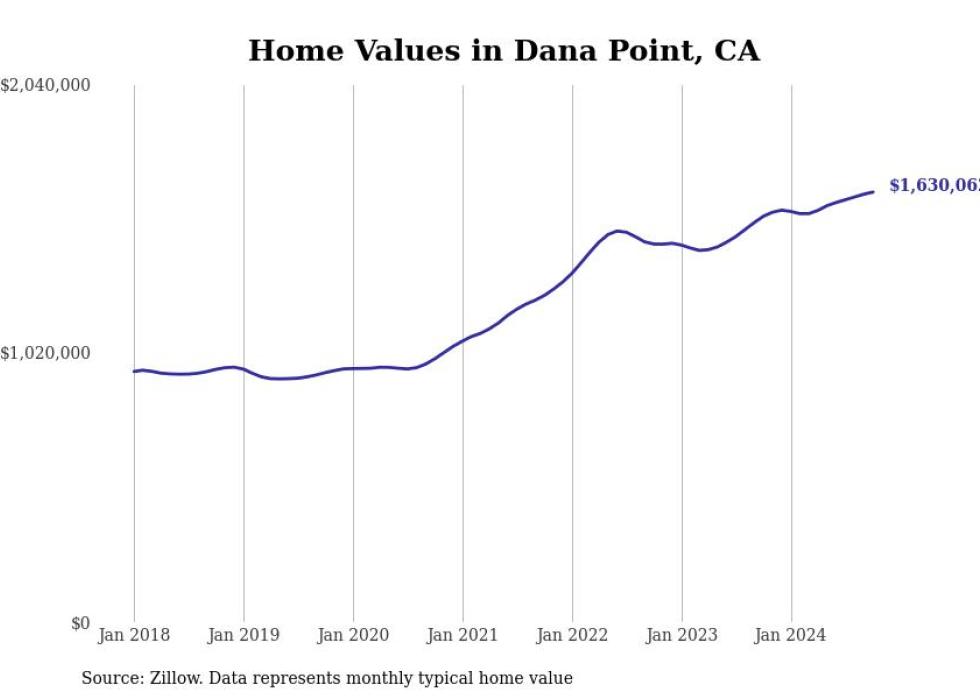
19. Dana Point
1-year price change: +$91,801 (+6.0%)
5-year price change: +$684,391 (+72.4%)
Typical home value: $1,630,062 (No. 23 most expensive city in metro)
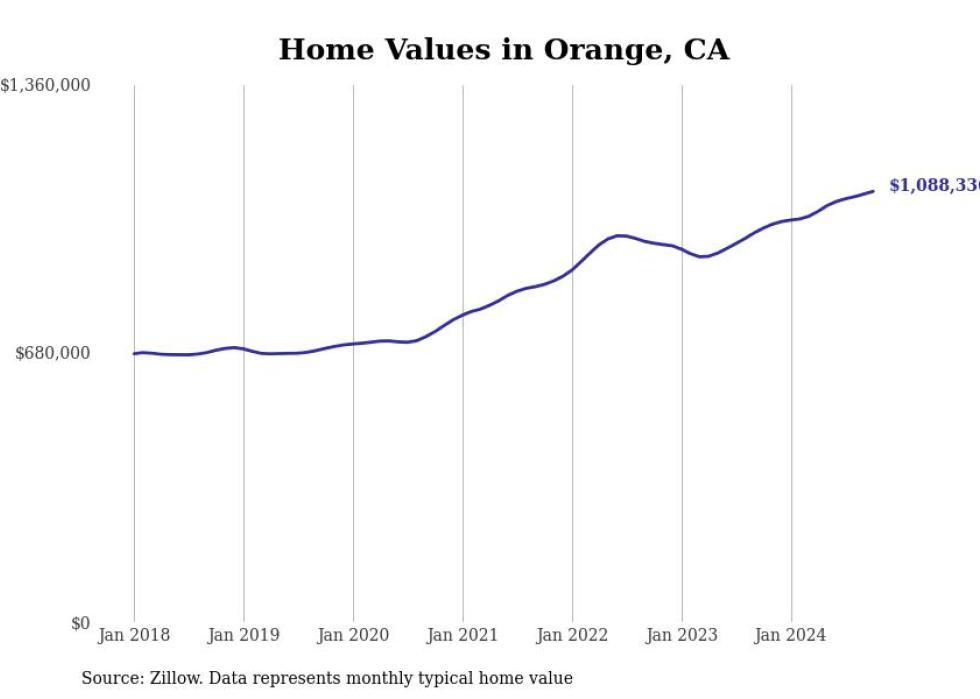
18. Orange
1-year price change: +$92,713 (+9.3%)
5-year price change: +$396,818 (+57.4%)
Typical home value: $1,088,336 (57th most expensive city in metro)
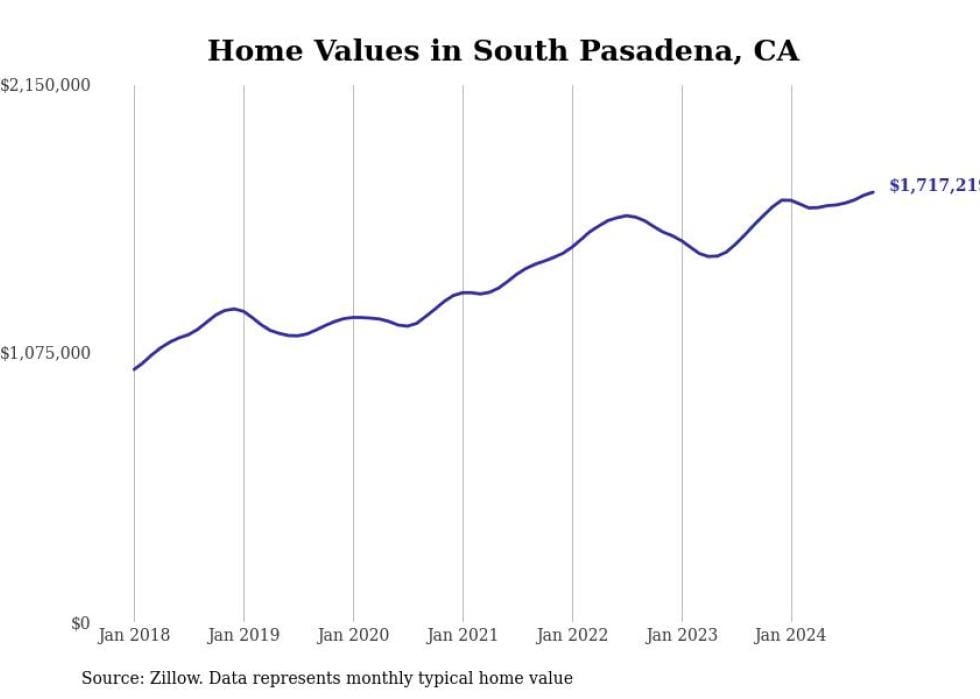
17. South Pasadena
1-year price change: +$93,395 (+5.8%)
5-year price change: +$532,350 (+44.9%)
Typical home value: $1,717,219 (17th most expensive city in metro)
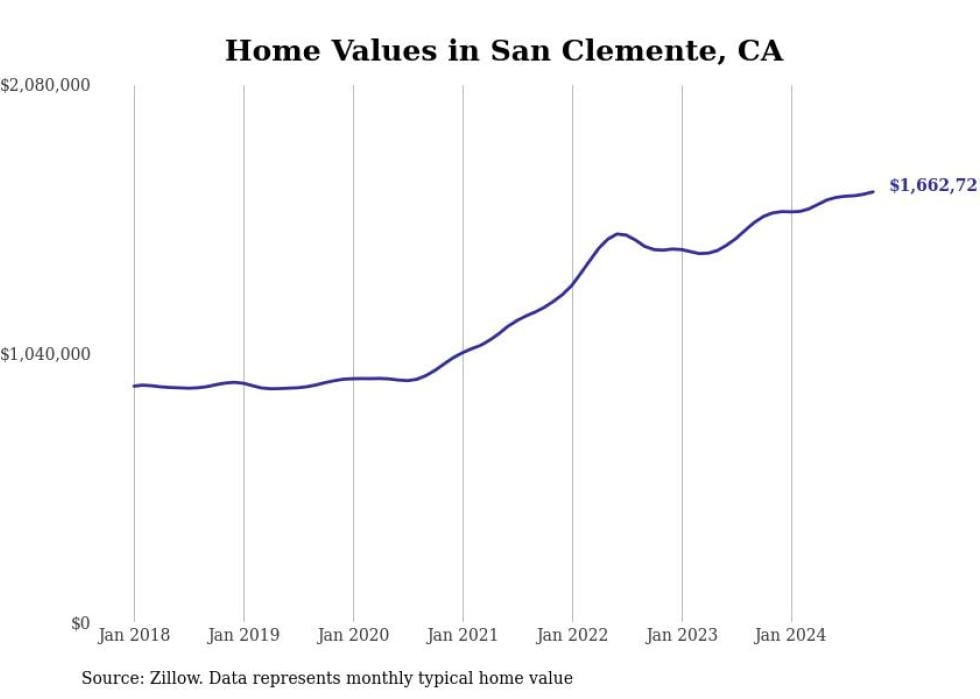
16. San Clemente
1-year price change: +$95,121 (+6.1%)
5-year price change: +$737,131 (+79.6%)
Typical home value: $1,662,721 (No. 20 most expensive city in metro)
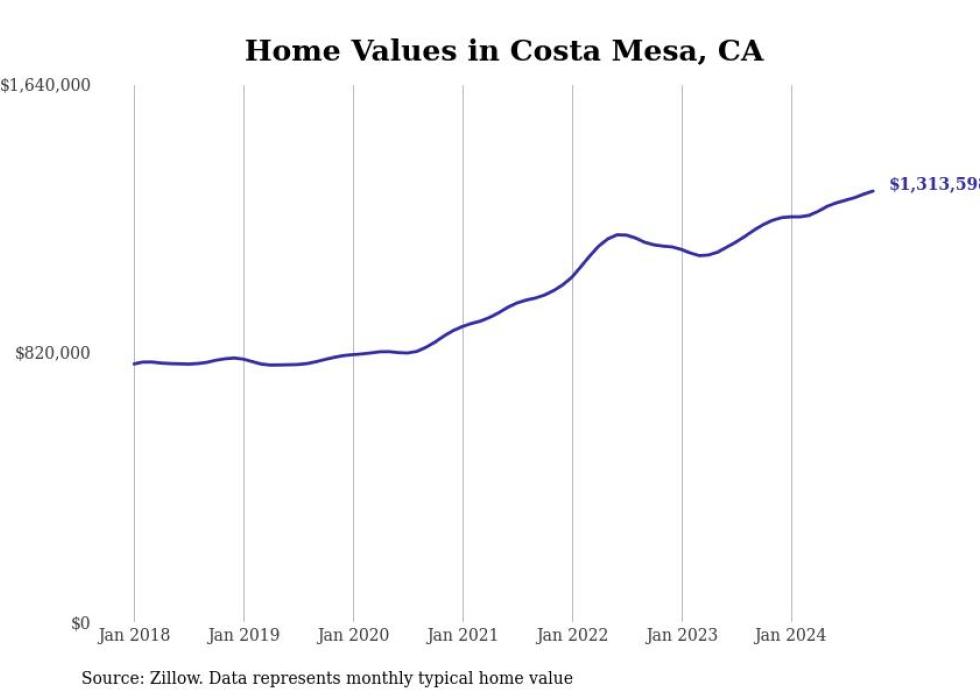
15. Costa Mesa
1-year price change: +$102,211 (+8.4%)
5-year price change: +$513,007 (+64.1%)
Typical home value: $1,313,598 (No. 37 most expensive city in metro)
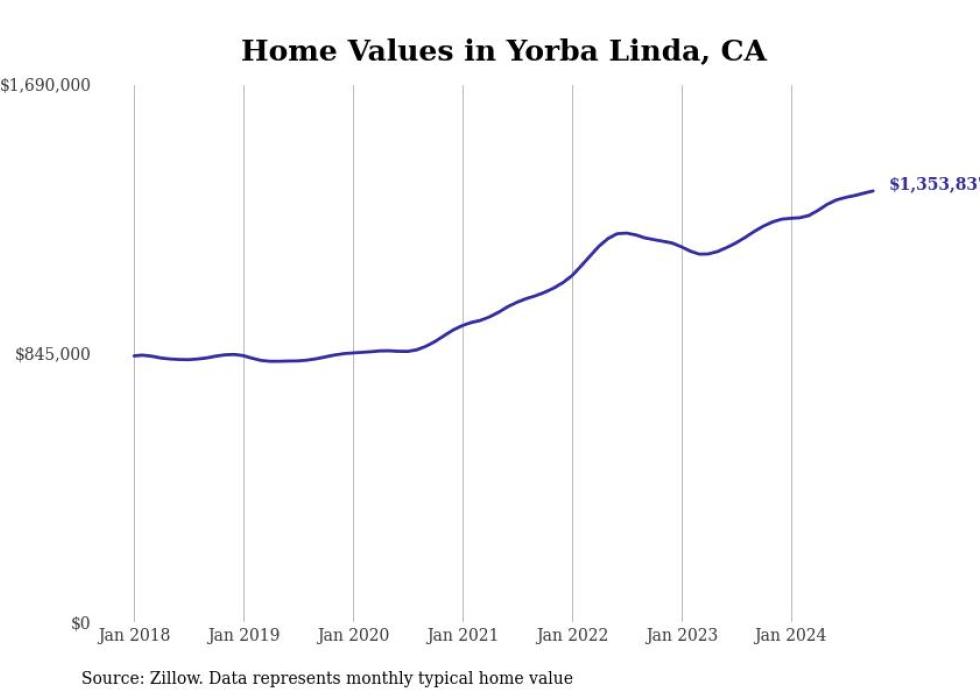
14. Yorba Linda
1-year price change: +$110,513 (+8.9%)
5-year price change: +$520,962 (+62.5%)
Typical home value: $1,353,837 (33rd most expensive city in metro)
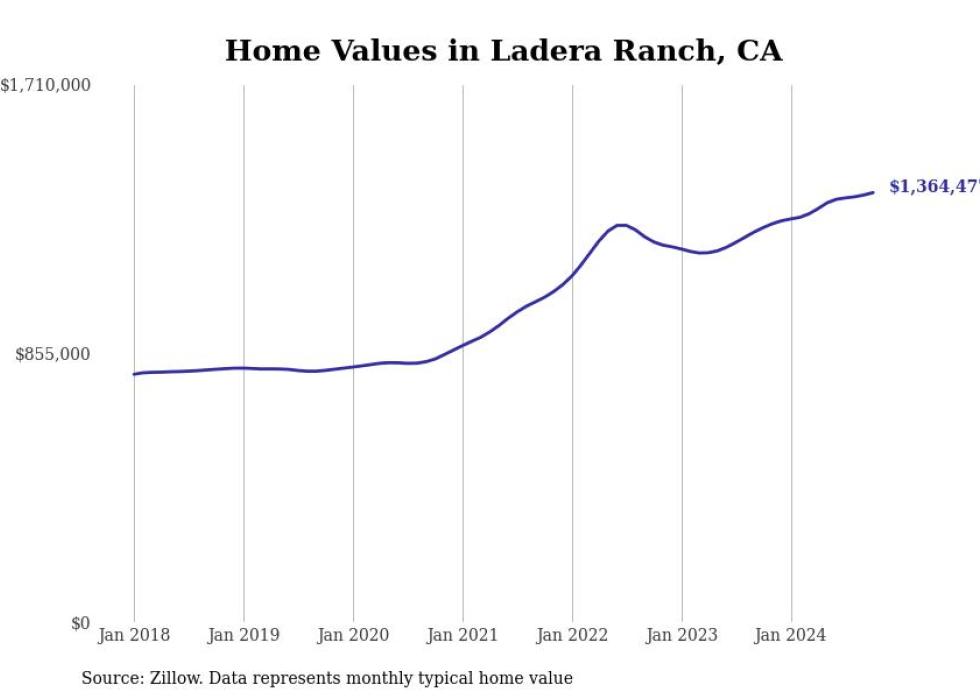
13. Ladera Ranch
1-year price change: +$110,935 (+8.8%)
5-year price change: +$564,742 (+70.6%)
Typical home value: $1,364,477 (No. 32 most expensive city in metro)
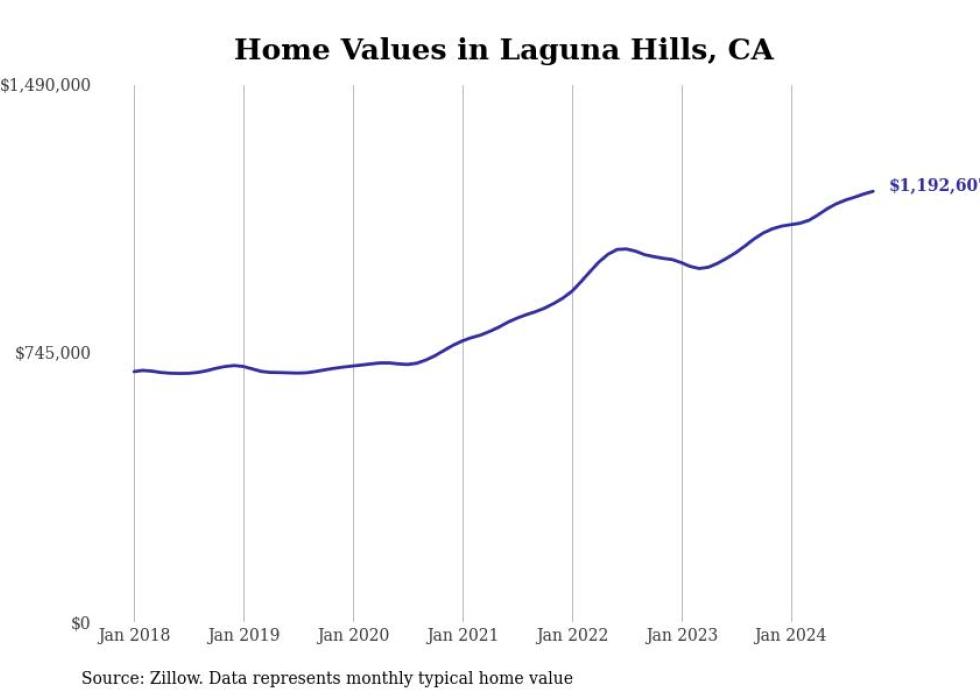
12. Laguna Hills
1-year price change: +$115,197 (+10.7%)
5-year price change: +$494,009 (+70.7%)
Typical home value: $1,192,607 (No. 46 most expensive city in metro)
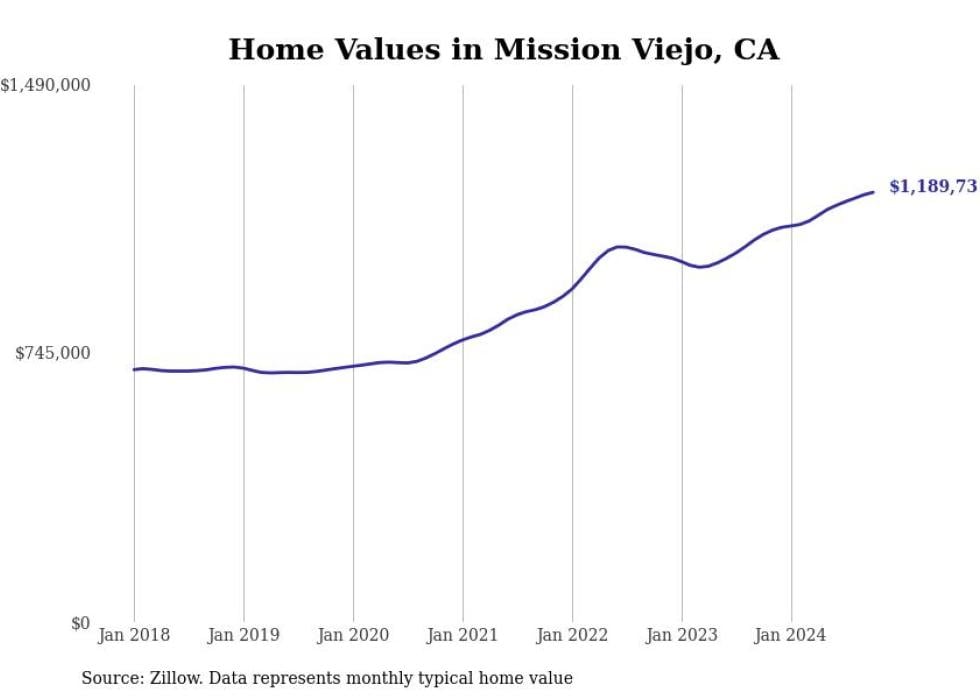
11. Mission Viejo
1-year price change: +$116,382 (+10.8%)
5-year price change: +$492,255 (+70.6%)
Typical home value: $1,189,731 (No. 47 most expensive city in metro)
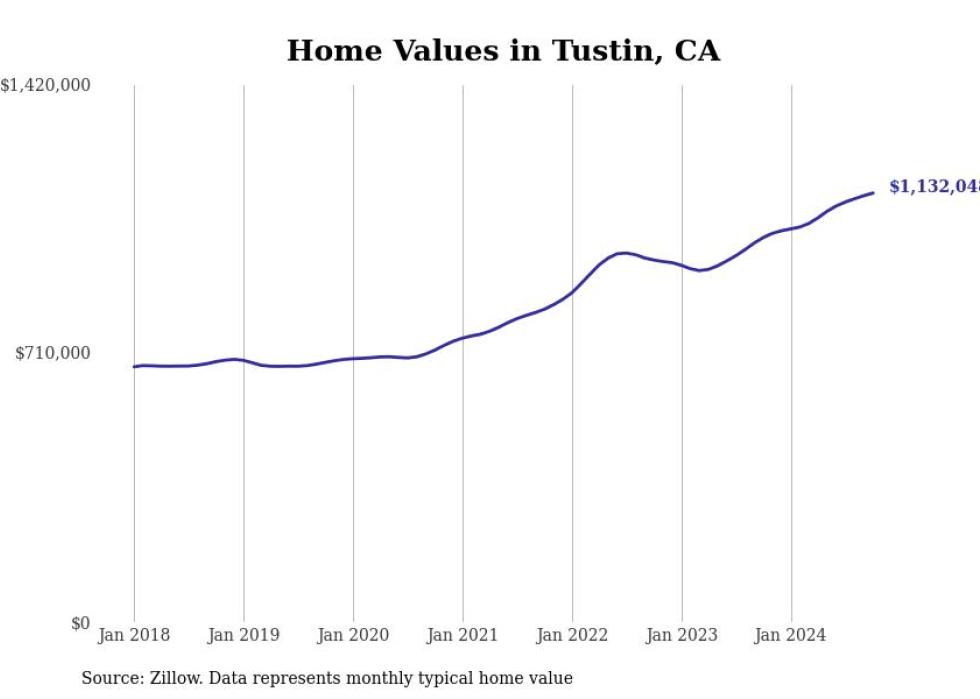
10. Tustin
1-year price change: +$117,289 (+11.6%)
5-year price change: +$446,878 (+65.2%)
Typical home value: $1,132,048 (55th most expensive city in metro)
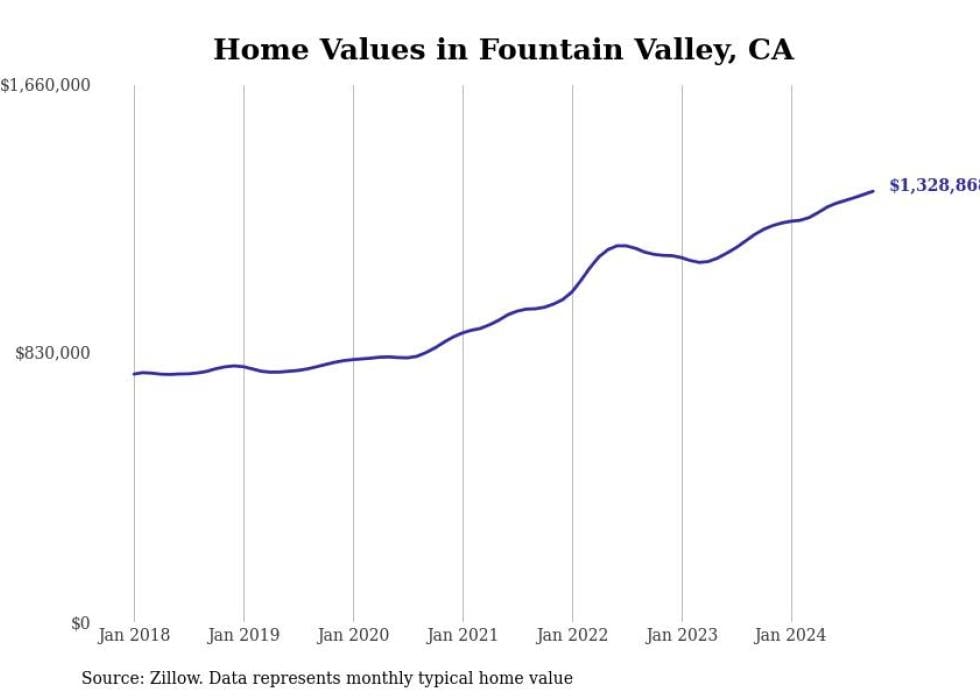
9. Fountain Valley
1-year price change: +$117,836 (+9.7%)
5-year price change: +$534,483 (+67.3%)
Typical home value: $1,328,868 (No. 35 most expensive city in metro)
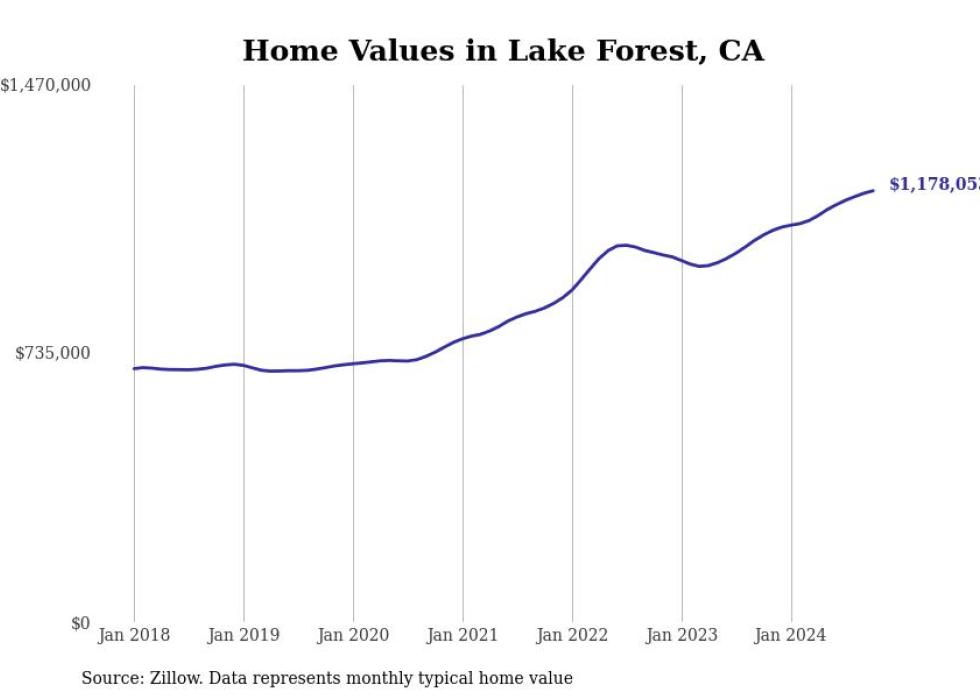
8. Lake Forest
1-year price change: +$120,974 (+11.4%)
5-year price change: +$483,024 (+69.5%)
Typical home value: $1,178,053 (48th most expensive city in metro)
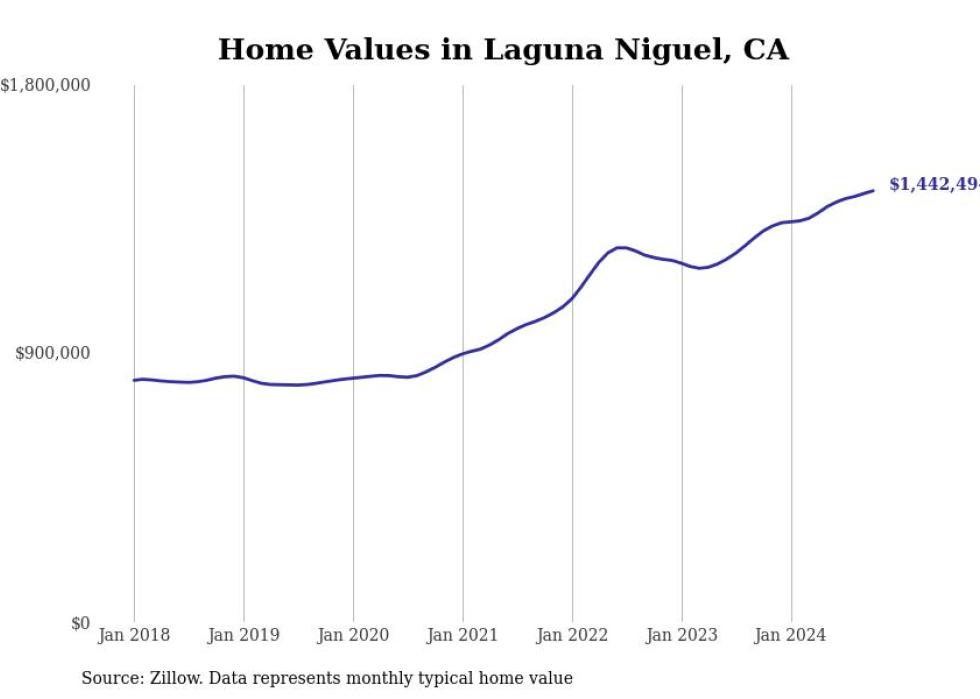
7. Laguna Niguel
1-year price change: +$134,095 (+10.2%)
5-year price change: +$638,925 (+79.5%)
Typical home value: $1,442,494 (No. 29 most expensive city in metro)
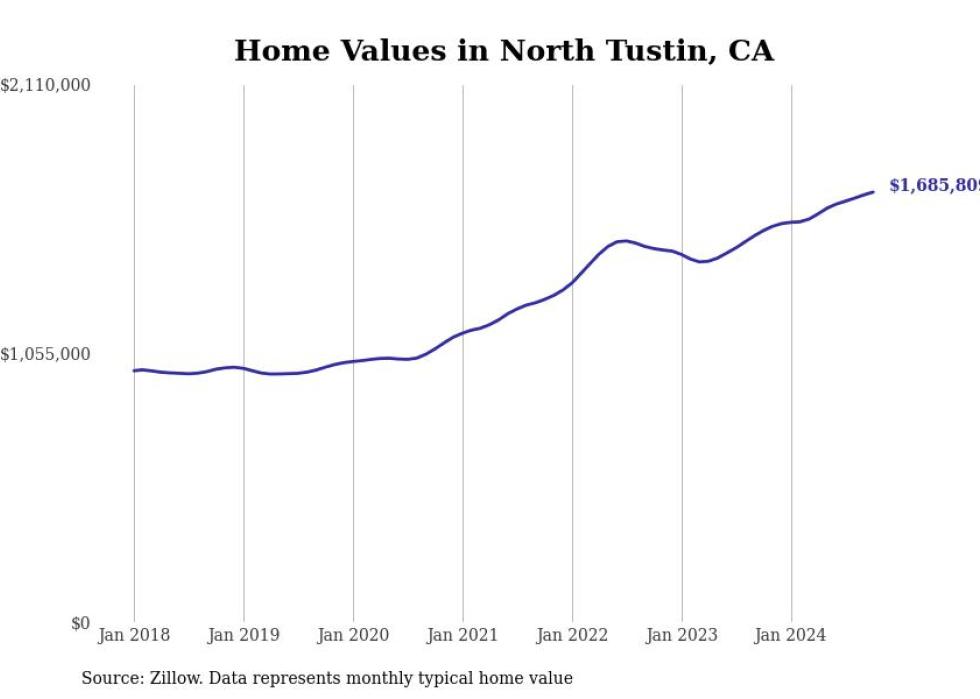
6. North Tustin
1-year price change: +$150,910 (+9.8%)
5-year price change: +$686,416 (+68.7%)
Typical home value: $1,685,809 (19th most expensive city in metro)
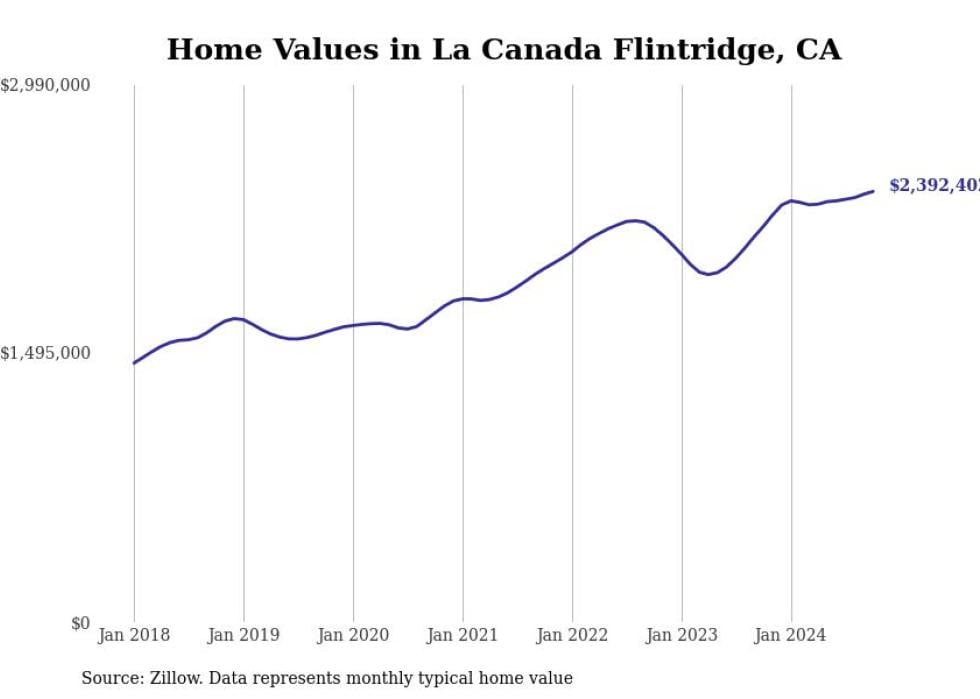
5. La Cañada Flintridge
1-year price change: +$193,779 (+8.8%)
5-year price change: +$781,764 (+48.5%)
Typical home value: $2,392,402 (No. 10 most expensive city in metro)
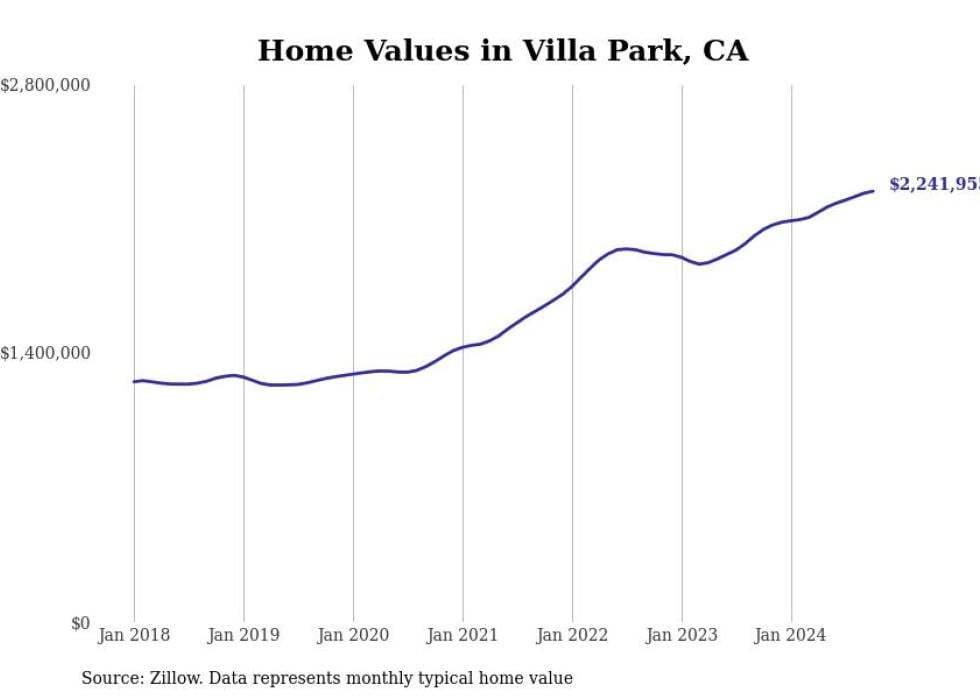
4. Villa Park
1-year price change: +$199,126 (+9.7%)
5-year price change: +$974,789 (+76.9%)
Typical home value: $2,241,955 (No. 11 most expensive city in metro)
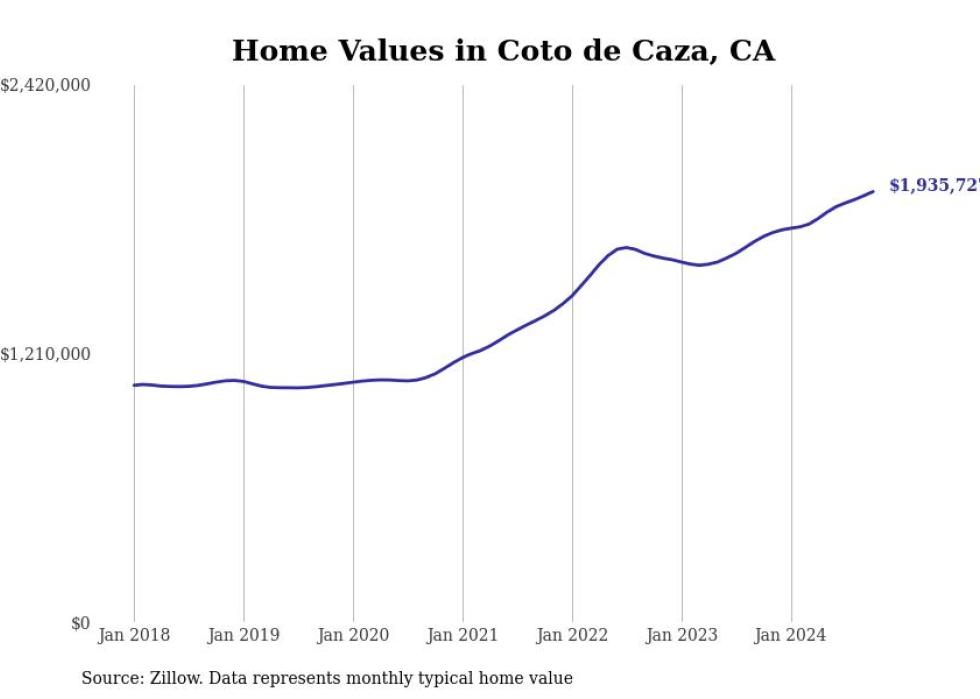
3. Coto de Caza
1-year price change: +$202,056 (+11.7%)
5-year price change: +$872,321 (+82.0%)
Typical home value: $1,935,727 (15th most expensive city in metro)
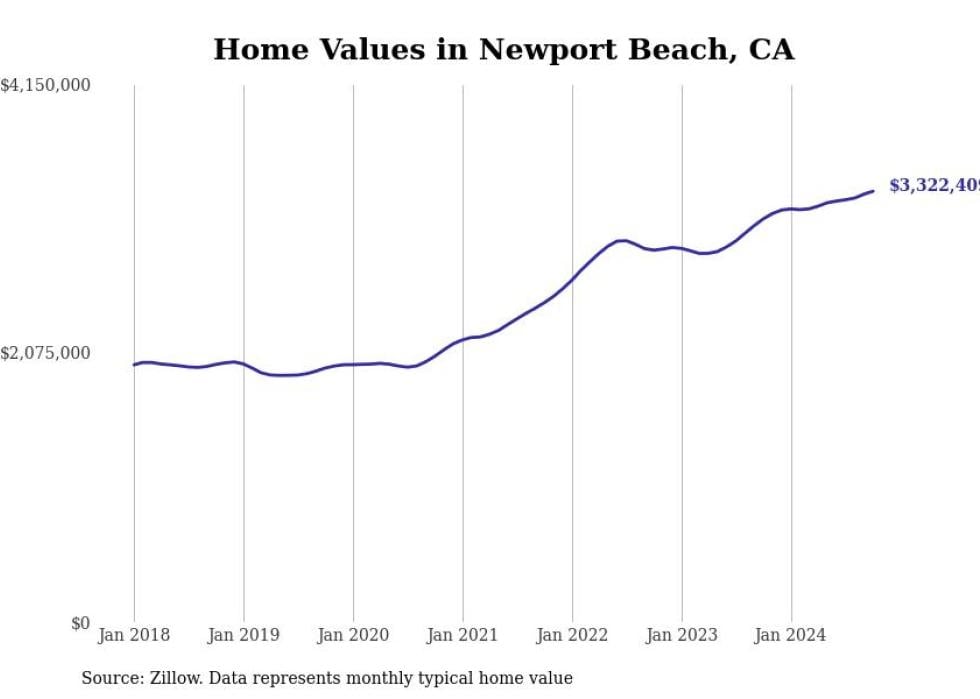
2. Newport Beach
1-year price change: +$212,615 (+6.8%)
5-year price change: +$1,363,216 (+69.6%)
Typical home value: $3,322,409 (No. 4 most expensive city in metro)
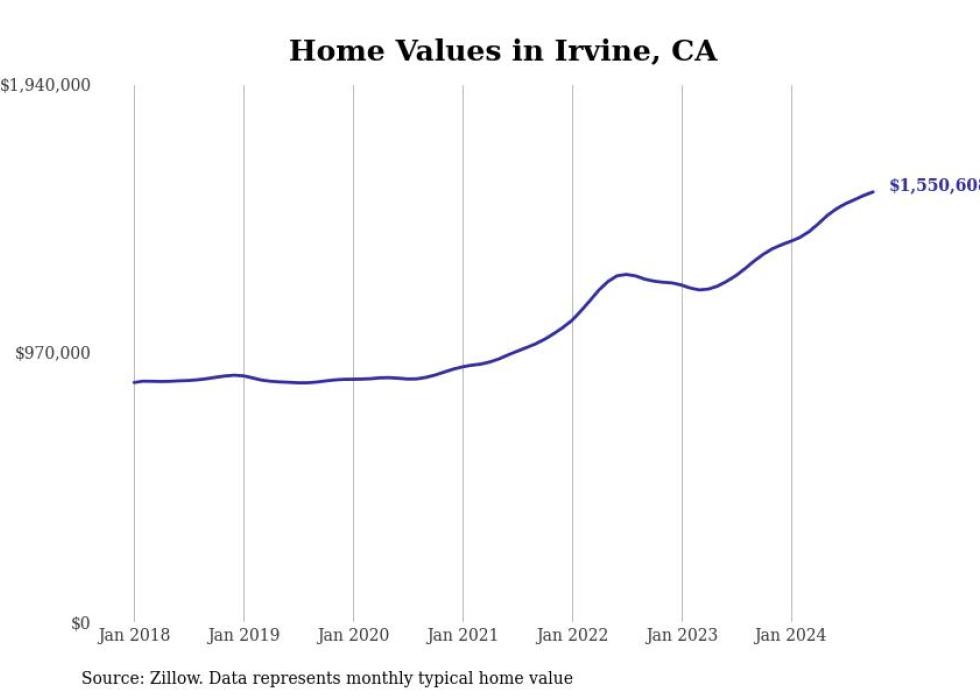
1. Irvine
1-year price change: +$224,513 (+16.9%)
5-year price change: +$681,406 (+78.4%)
Typical home value: $1,550,608 (26th most expensive city in metro)
This article was retitled and copy edited from its original version.
Re-published with CC BY-NC 4.0 License.