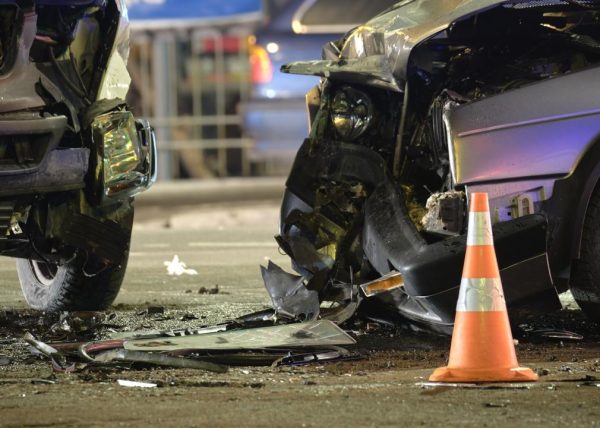
California is the No. 28 state for fatal car accidents in America, experiencing 1.1 fatal crashes per 10,000 residents in 2022. Overall, 4,428 people died in California car accidents that year.
Truck Parking Club used data from the National Highway Traffic Safety Administration to rank the cities in California with the highest accident rates as part of a larger national analysis.
Rankings are based on the rate of accidents per 10,000 residents in 2022. Ties were broken by the total number of fatal accidents, though some ties may remain. Only cities with at least 10 fatal crashes and 20,000 residents were included in the analysis. Cities without available Census Bureau population estimates were not included.
More than 42,000 Americans died in car crashes in 2022, making these accidents a leading cause of death in the U.S. These deaths occurred during over 39,000 crashes that year — about one crash per 10,000 U.S. residents, according to National Highway Traffic Safety Administration tallies. But in some cities, the roads are more deadly than in others.
Fatal car crash rates fell for several decades as federal and state governments adopted safety regulations for vehicle manufacturers and occupants.
But rates went up in 2020 and 2021, with increases in fatalities related to alcohol and speeding. When COVID-19 restrictions decreased the number of cars on the road, many drivers adopted risky driving behaviors that have persisted even as traffic returned to normal.
While fatalities decreased in 2022, they remain higher than they’ve been in over a decade.
Nationally, nearly all of the top 25 cities for fatal crashes were in the Southeast. Most were smaller cities: Over half had populations of fewer than 50,000, while only three had more than 100,000 residents. They also tended to be far from major cities.
Geographic hazards exist in most, including hilly terrain, winding rivers and dense forests. Nearly all of the top cities have some type of waterfront — rivers, lakes, coasts and the like — which may pose distractions for drivers taking in the view.
Read on to see the cities in California that were affected most by fatal car crashes.
No. 25 – Westminster
– Fatal accidents per 10,000 residents: 1.1 (About the same as the national average)
– Total fatal accidents: 10 (10 fatalities)
– Most common crash site: Other
No. 24 – Fresno
– Fatal accidents per 10,000 residents: 1.1 (About the same as the national average)
– Total fatal accidents: 62 (65 fatalities)
– Most common crash site: Other
No. 23 – El Cajon
– Fatal accidents per 10,000 residents: 1.2 (About the same as the national average)
– Total fatal accidents: 13 (13 fatalities)
– Most common crash site: Other
No. 22 – Palmdale
– Fatal accidents per 10,000 residents: 1.2 (About the same as the national average)
– Total fatal accidents: 20 (21 fatalities)
– Most common crash site: Other
No. 21 – Bellflower
– Fatal accidents per 10,000 residents: 1.3 (About the same as the national average)
– Total fatal accidents: 10 (11 fatalities)
– Most common crash site: Other
No. 20 – Merced
– Fatal accidents per 10,000 residents: 1.3 (About the same as the national average)
– Total fatal accidents: 12 (13 fatalities)
– Most common crash site: Other
No. 19 – Fairfield
– Fatal accidents per 10,000 residents: 1.3 (About the same as the national average)
– Total fatal accidents: 15 (15 fatalities)
– Most common crash site: Interstates (7 fatal accidents)
No. 18 – Bakersfield
– Fatal accidents per 10,000 residents: 1.3 (About the same as the national average)
– Total fatal accidents: 55 (55 fatalities)
– Most common crash site: Other
No. 17 – Long Beach
– Fatal accidents per 10,000 residents: 1.3 (About the same as the national average)
– Total fatal accidents: 57 (59 fatalities)
– Most common crash site: Other
No. 16 – Orange
– Fatal accidents per 10,000 residents: 1.4 (About 1.2x the national average)
– Total fatal accidents: 19 (21 fatalities)
– Most common crash site: Other
No. 15 – Corona
– Fatal accidents per 10,000 residents: 1.4 (About 1.2x the national average)
– Total fatal accidents: 22 (23 fatalities)
– Most common crash site: Other
No. 14 – Fontana
– Fatal accidents per 10,000 residents: 1.4 (About 1.2x the national average)
– Total fatal accidents: 30 (37 fatalities)
– Most common crash site: Other
No. 13 – Sacramento
– Fatal accidents per 10,000 residents: 1.4 (About 1.2x the national average)
– Total fatal accidents: 72 (77 fatalities)
– Most common crash site: Other
No. 12 – Vallejo
– Fatal accidents per 10,000 residents: 1.5 (About 1.3x the national average)
– Total fatal accidents: 18 (19 fatalities)
– Most common crash site: State highways (6 fatal accidents)
No. 10 – Apple Valley (tie)
– Fatal accidents per 10,000 residents: 1.6 (About 1.4x the national average)
– Total fatal accidents: 12 (12 fatalities)
– Most common crash site: Other
No. 10 – Redlands (tie)
– Fatal accidents per 10,000 residents: 1.6 (About 1.4x the national average)
– Total fatal accidents: 12 (12 fatalities)
– Most common crash site: Other
No. 9 – Buena Park
– Fatal accidents per 10,000 residents: 1.7 (About 1.4x the national average)
– Total fatal accidents: 14 (14 fatalities)
– Most common crash site: Other
No. 8 – Lancaster
– Fatal accidents per 10,000 residents: 1.7 (About 1.4x the national average)
– Total fatal accidents: 29 (31 fatalities)
– Most common crash site: Other
No. 7 – San Jacinto
– Fatal accidents per 10,000 residents: 1.8 (About 1.5x the national average)
– Total fatal accidents: 10 (11 fatalities)
– Most common crash site: Other
No. 6 – Riverside
– Fatal accidents per 10,000 residents: 1.8 (About 1.5x the national average)
– Total fatal accidents: 57 (58 fatalities)
– Most common crash site: Other
No. 5 – Compton
– Fatal accidents per 10,000 residents: 1.9 (About 1.6x the national average)
– Total fatal accidents: 17 (19 fatalities)
– Most common crash site: Other
No. 4 – Hesperia
– Fatal accidents per 10,000 residents: 1.9 (About 1.6x the national average)
– Total fatal accidents: 19 (21 fatalities)
– Most common crash site: Other
No. 3 – Colton
– Fatal accidents per 10,000 residents: 2.4 (About 2.0x the national average)
– Total fatal accidents: 13 (14 fatalities)
– Most common crash site: Other
No. 2 – San Bernardino
– Fatal accidents per 10,000 residents: 2.4 (About 2.0x the national average)
– Total fatal accidents: 53 (57 fatalities)
– Most common crash site: Other
No. 1 – Victorville
– Fatal accidents per 10,000 residents: 2.6 (About 2.2x the national average)
– Total fatal accidents: 36 (39 fatalities)
– Most common crash site: Other
This story features data reporting and writing by Paxtyn Merten and is part of a series utilizing data automation across 29 states.
This story originally appeared on Truck Parking Club and was produced and distributed in partnership with Stacker Studio. The article was retitled and copy edited from its original version.
Re-published with CC BY-NC 4.0 License.


