Purchasing a home is one of the most important investments there is. More than a place to live, homeownership is an asset with the potential to tremendously rise in value. But with home prices reaching record heights, affordability plays a huge role for buyers.
The typical home value in the United States was $359,402 in April, 4.4% higher than the year before. High mortgage rates are also making monthly payments more expensive; as of May 23, the 30-year fixed mortgage rate sits at 6.94%.
Although home prices have inflated all across the U.S., there are some cities that command a higher price tag than others. Location, size, age and condition are all contributing factors to home value.
Stacker compiled a list of cities with the most expensive homes in the Los Angeles metro area using data from Zillow. Charts show the monthly typical home prices since January 2018. Data was available for 152 cities and towns.
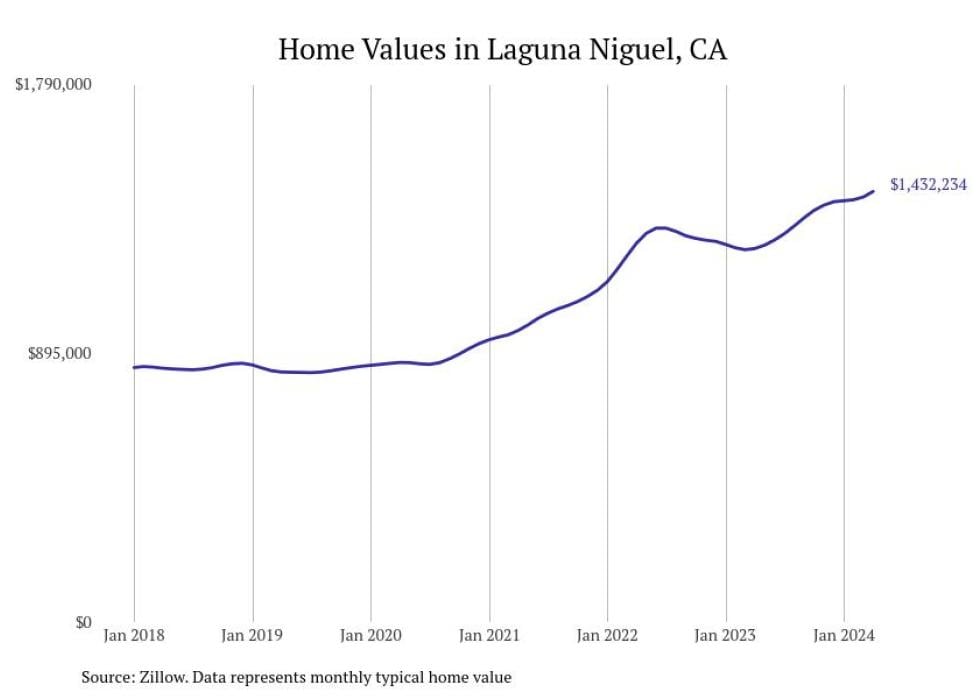
No. 30. Laguna Niguel
– Typical home value: $1,432,234
– 1-year price change: +15.3%
– 5-year price change: +72.2%
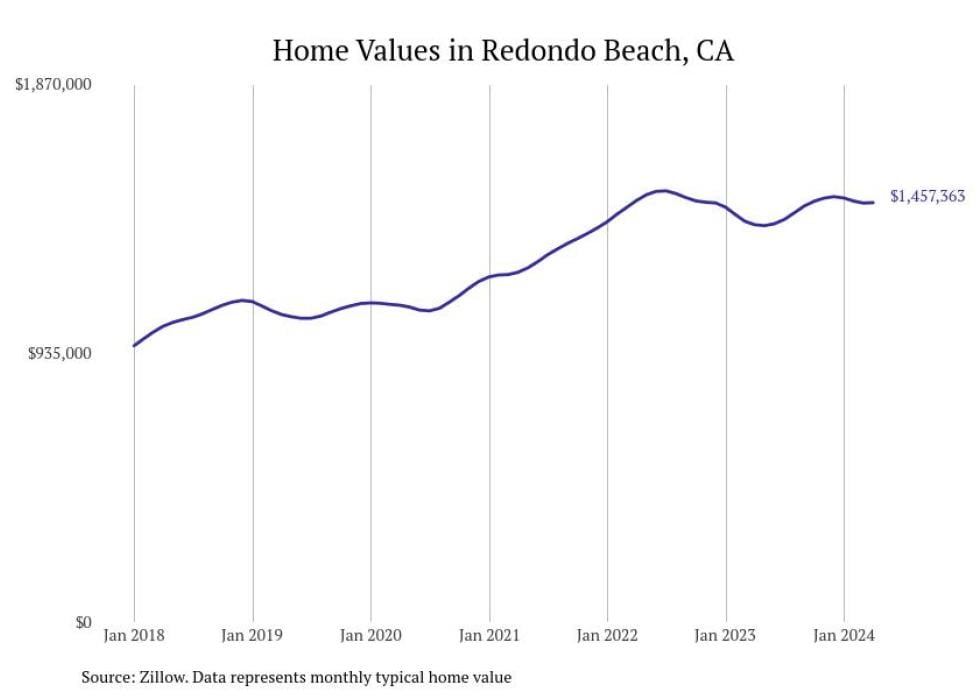
29. Redondo Beach
– Typical home value: $1,457,363
– 1-year price change: +5.6%
– 5-year price change: +36.3%
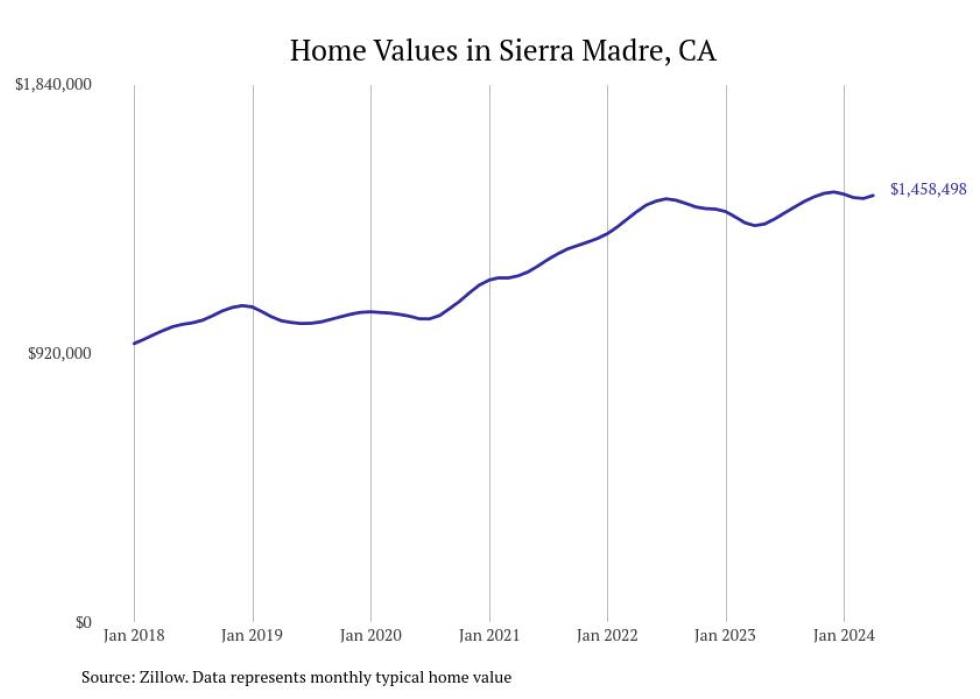
28. Sierra Madre
– Typical home value: $1,458,498
– 1-year price change: +7.6%
– 5-year price change: +41.6%
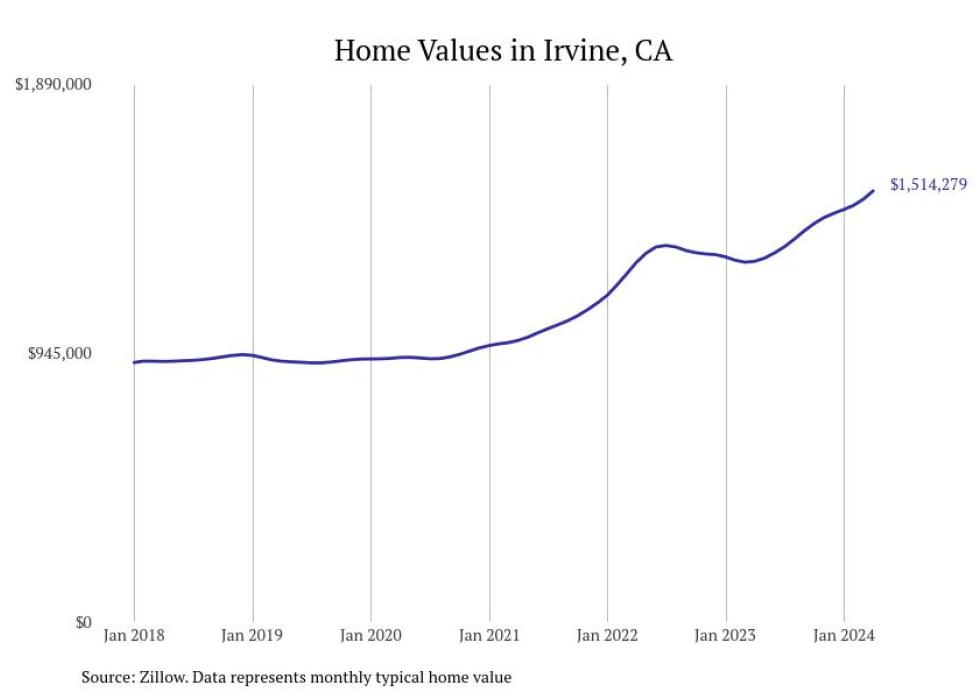
27. Irvine
– Typical home value: $1,514,279
– 1-year price change: +19.5%
– 5-year price change: +65.2%
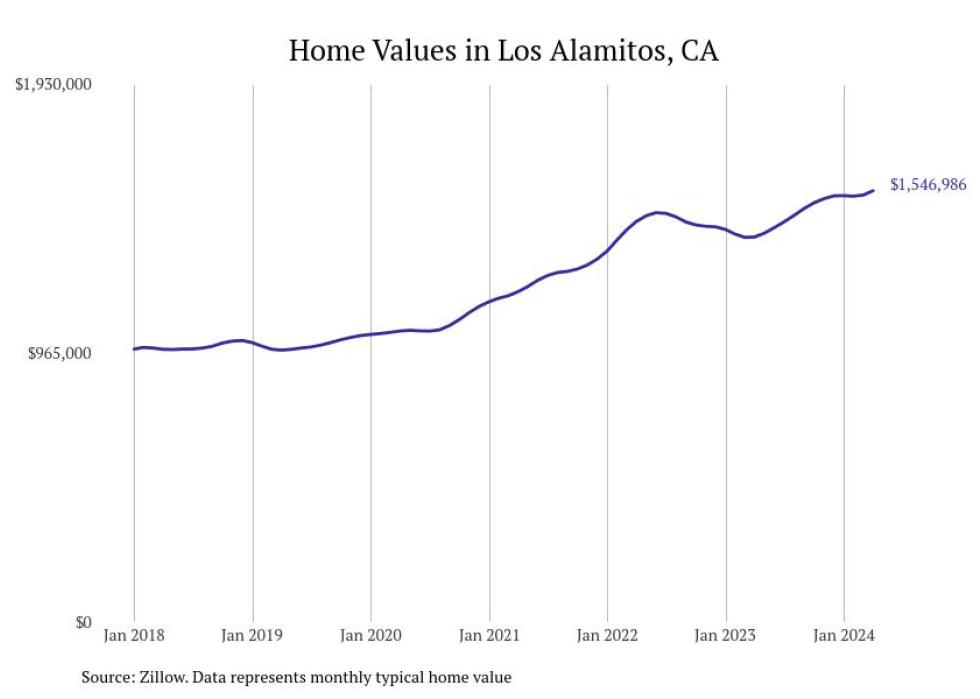
26. Los Alamitos
– Typical home value: $1,546,986
– 1-year price change: +12.0%
– 5-year price change: +58.6%
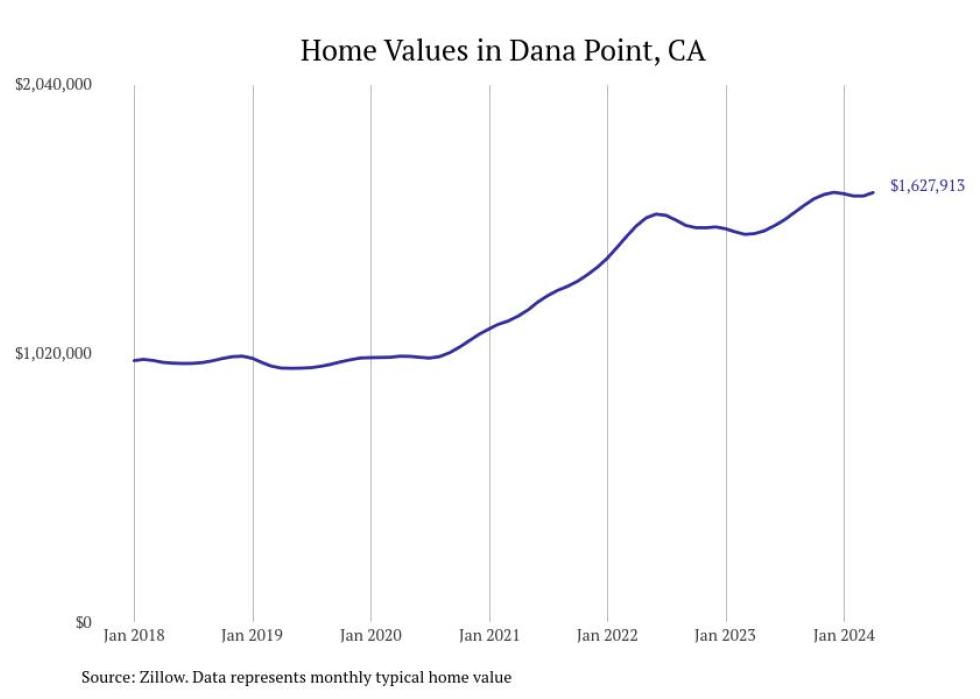
25. Dana Point
– Typical home value: $1,627,913
– 1-year price change: +10.6%
– 5-year price change: +69.1%
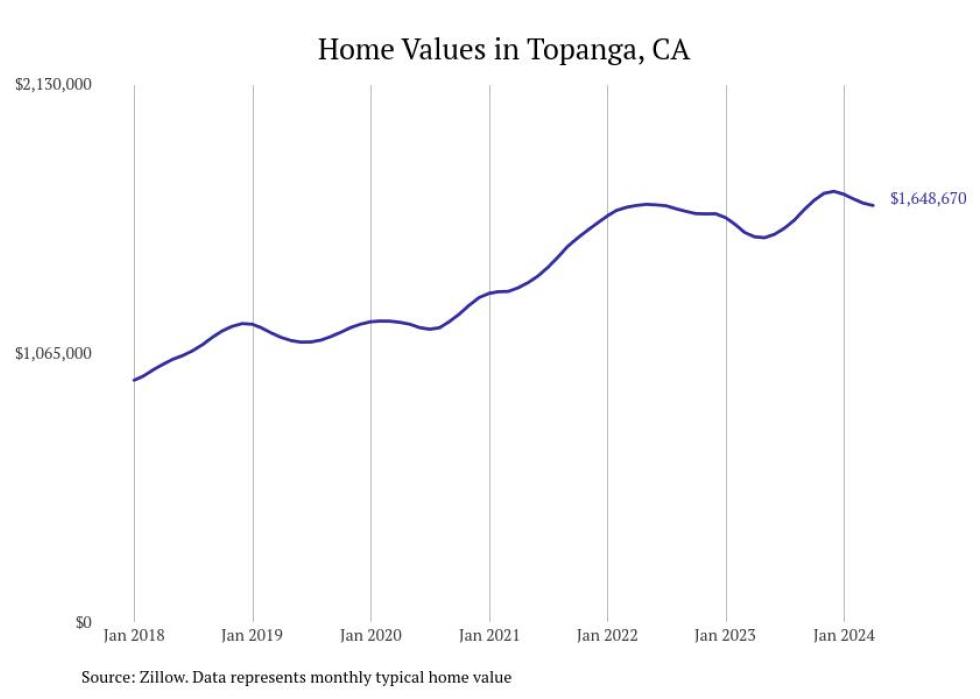
24. Topanga
– Typical home value: $1,648,670
– 1-year price change: +8.1%
– 5-year price change: +46.3%
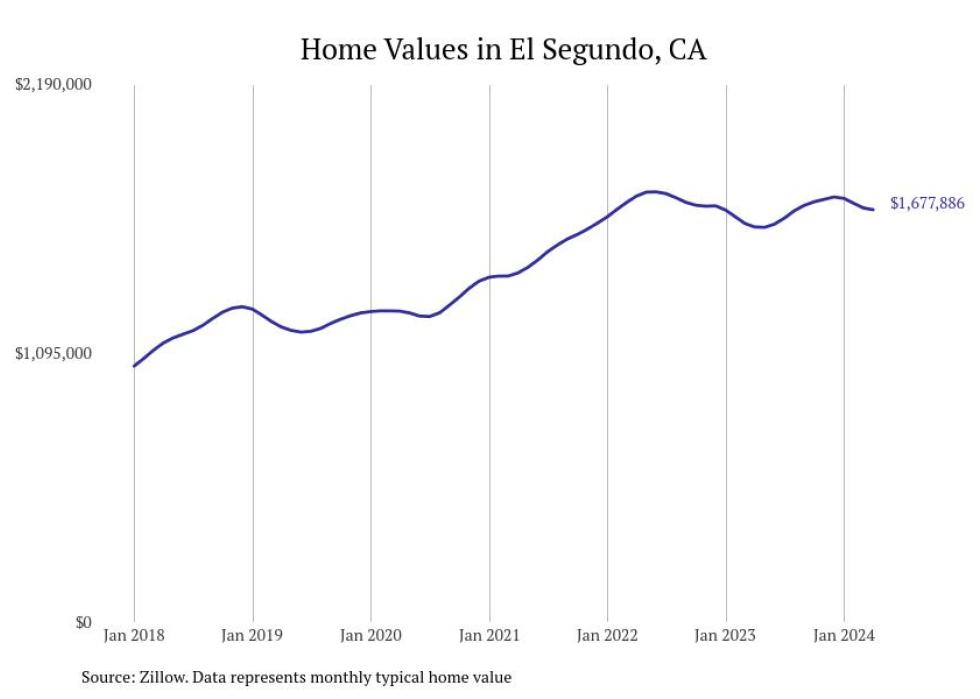
23. El Segundo
– Typical home value: $1,677,886
– 1-year price change: +4.4%
– 5-year price change: +39.7%
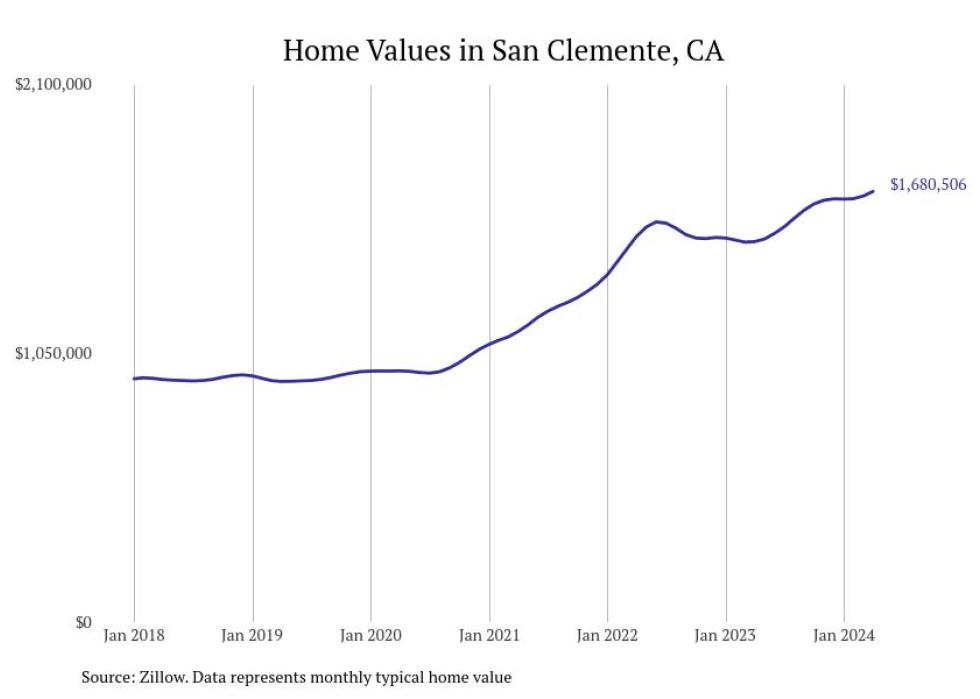
22. San Clemente
– Typical home value: $1,680,506
– 1-year price change: +13.2%
– 5-year price change: +79.0%
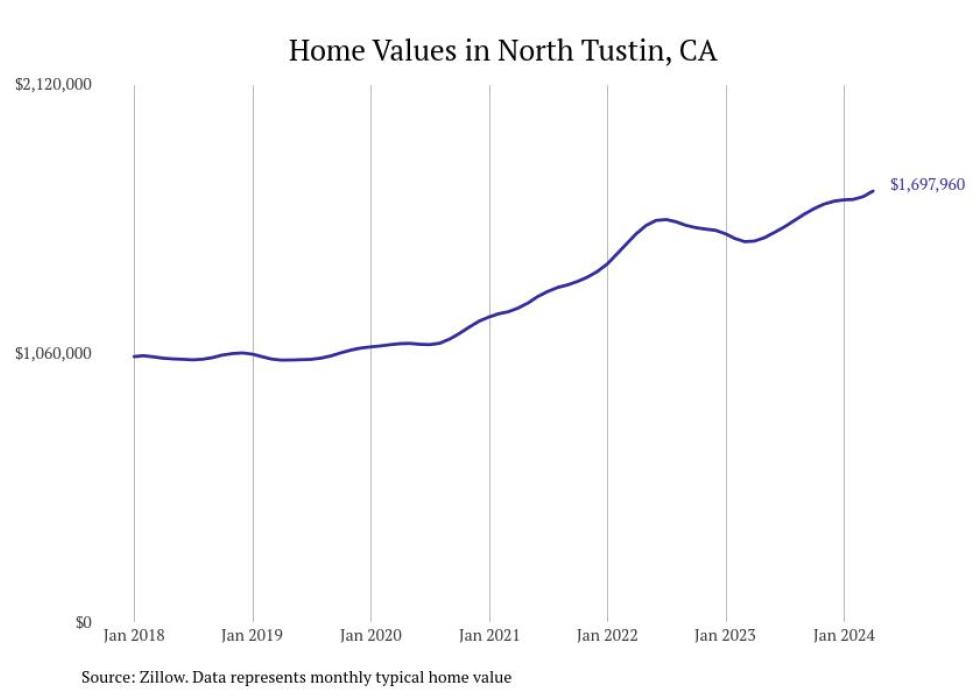
21. North Tustin
– Typical home value: $1,697,960
– 1-year price change: +13.1%
– 5-year price change: +64.5%
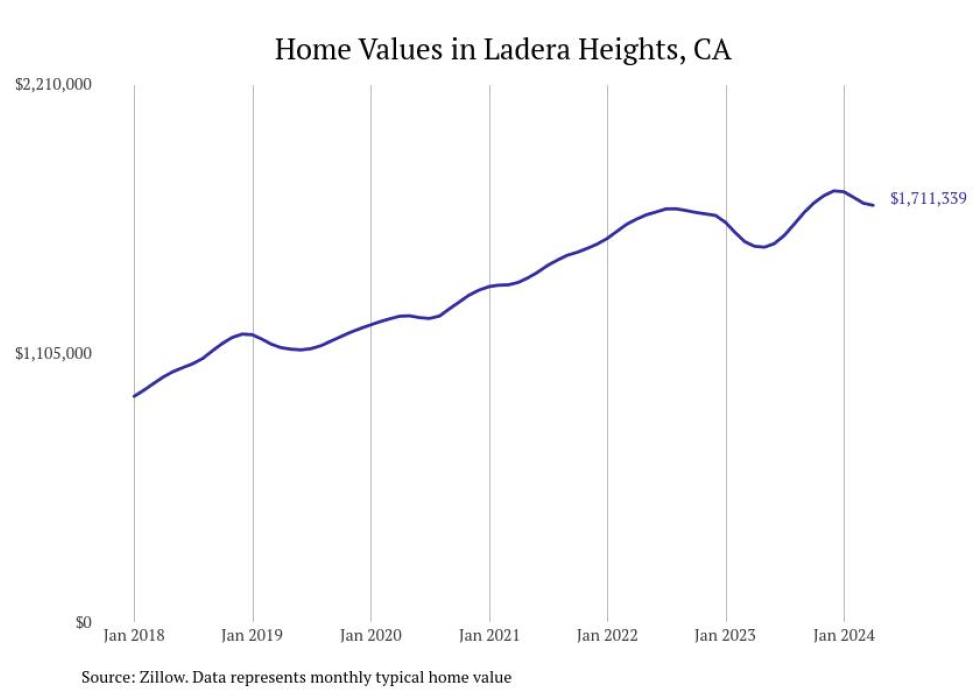
20. Ladera Heights
– Typical home value: $1,711,339
– 1-year price change: +10.9%
– 5-year price change: +51.9%
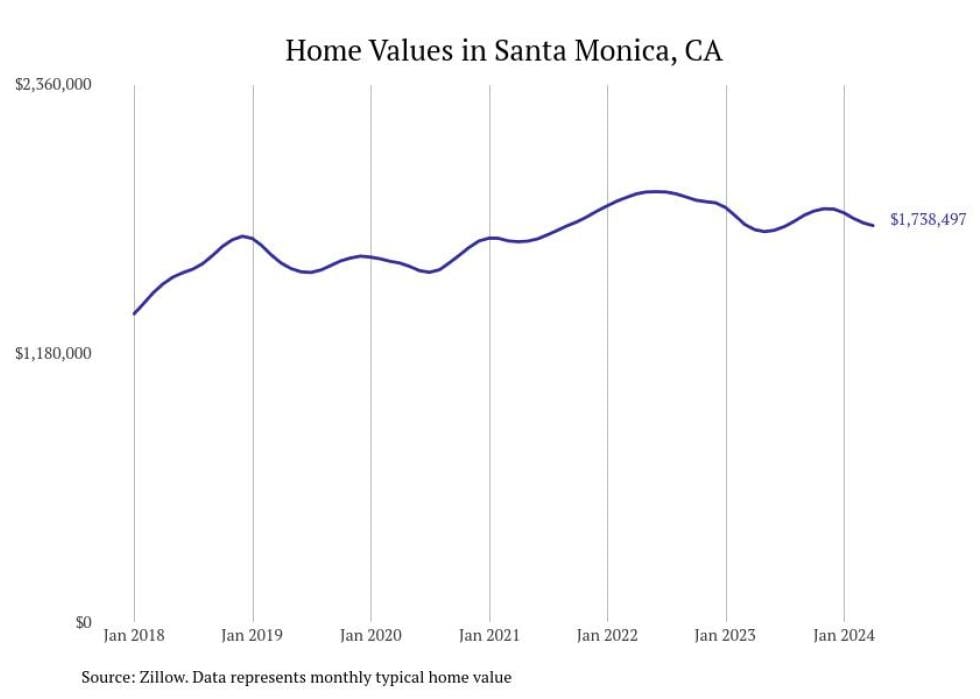
19. Santa Monica
– Typical home value: $1,738,497
– 1-year price change: +1.0%
– 5-year price change: +10.4%
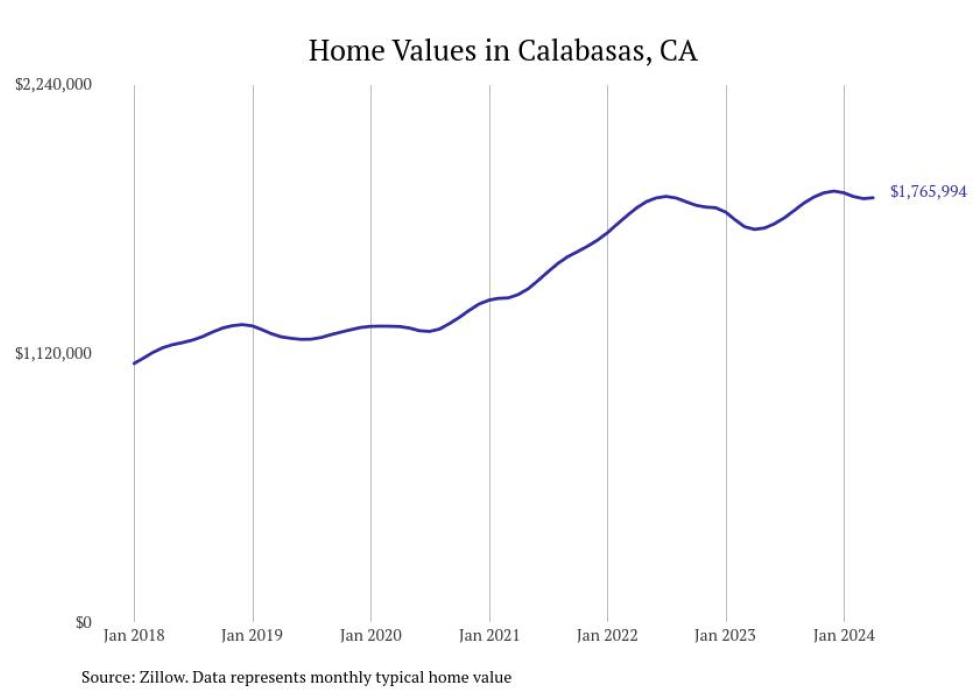
18. Calabasas
– Typical home value: $1,765,994
– 1-year price change: +8.1%
– 5-year price change: +48.7%
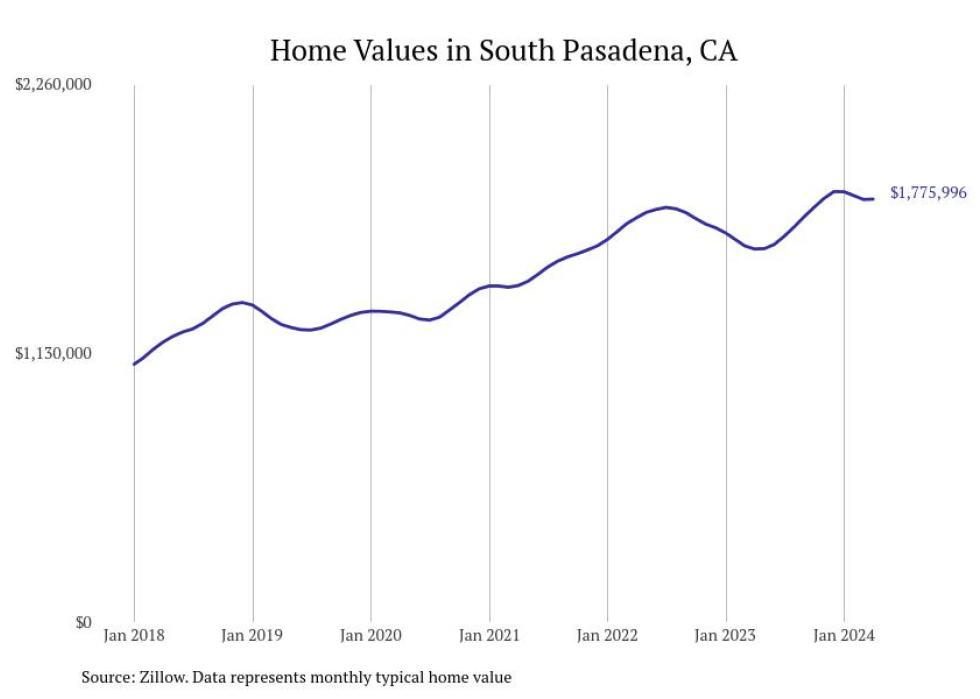
17. South Pasadena
– Typical home value: $1,775,996
– 1-year price change: +13.4%
– 5-year price change: +42.1%
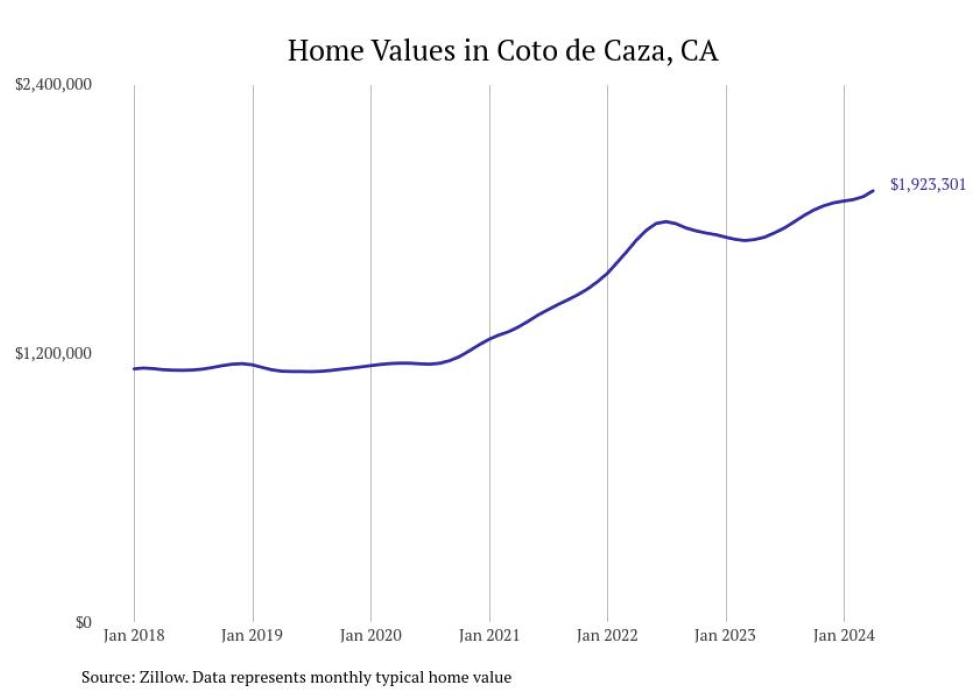
16. Coto de Caza
– Typical home value: $1,923,301
– 1-year price change: +12.7%
– 5-year price change: +71.9%
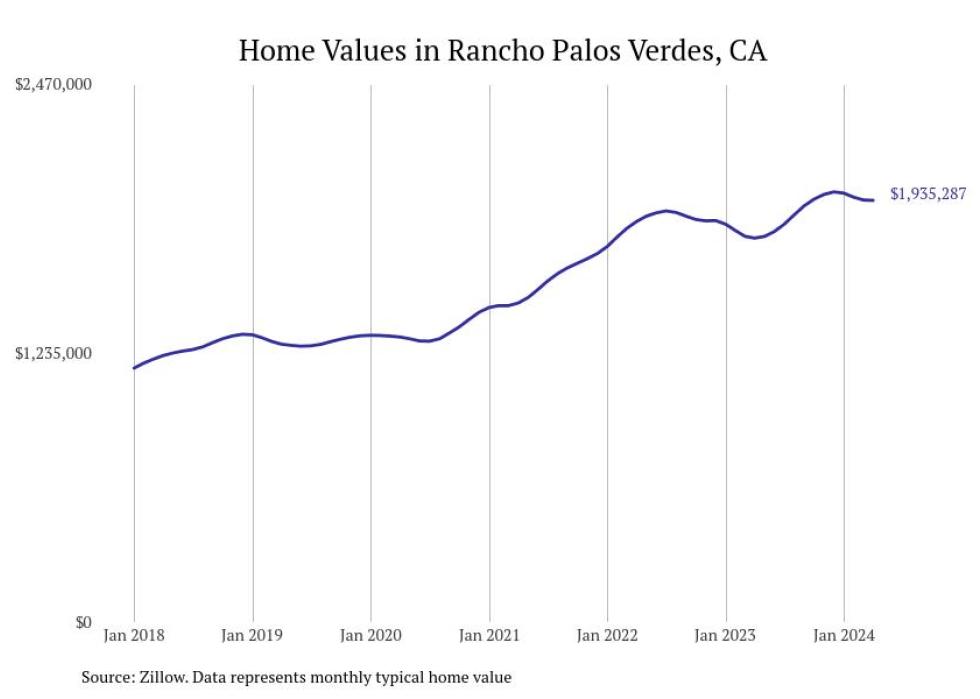
15. Rancho Palos Verdes
– Typical home value: $1,935,287
– 1-year price change: +9.8%
– 5-year price change: +51.7%
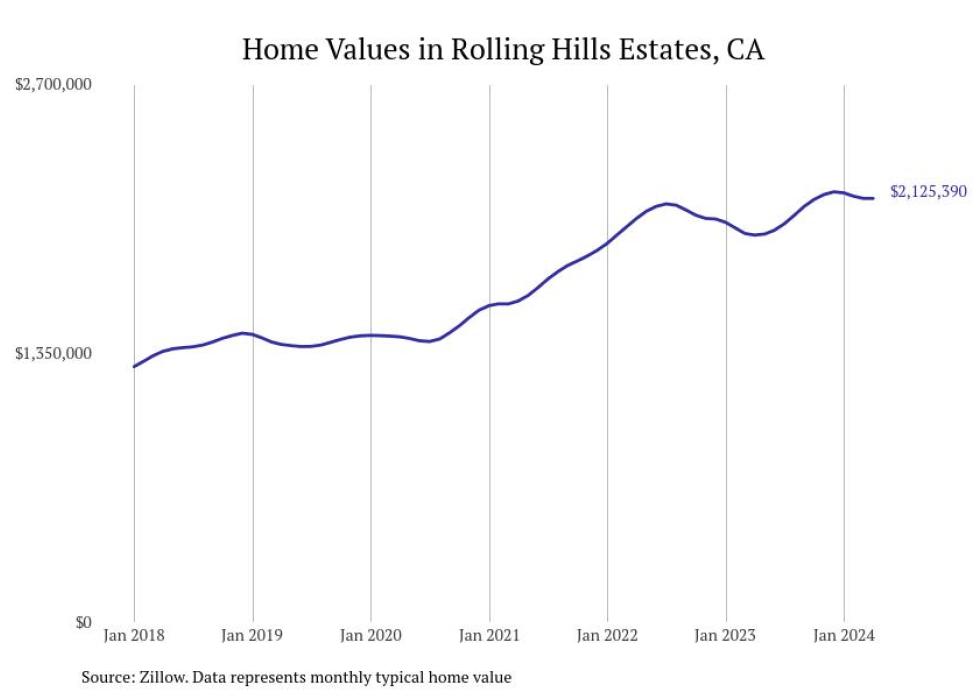
14. Rolling Hills Estates
– Typical home value: $2,125,390
– 1-year price change: +9.5%
– 5-year price change: +52.6%
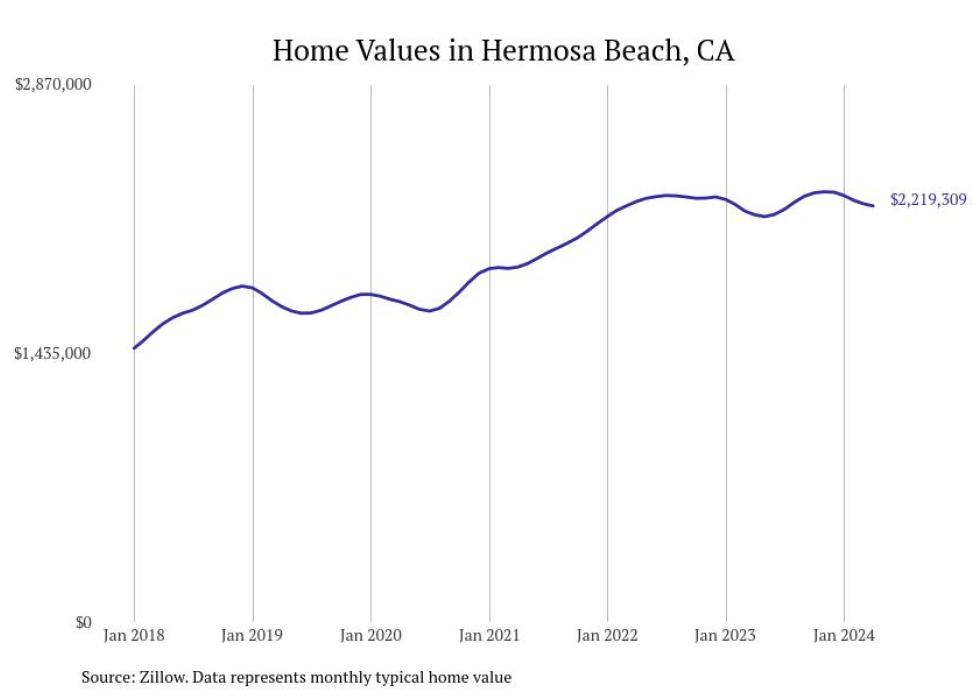
13. Hermosa Beach
– Typical home value: $2,219,309
– 1-year price change: +2.2%
– 5-year price change: +31.8%
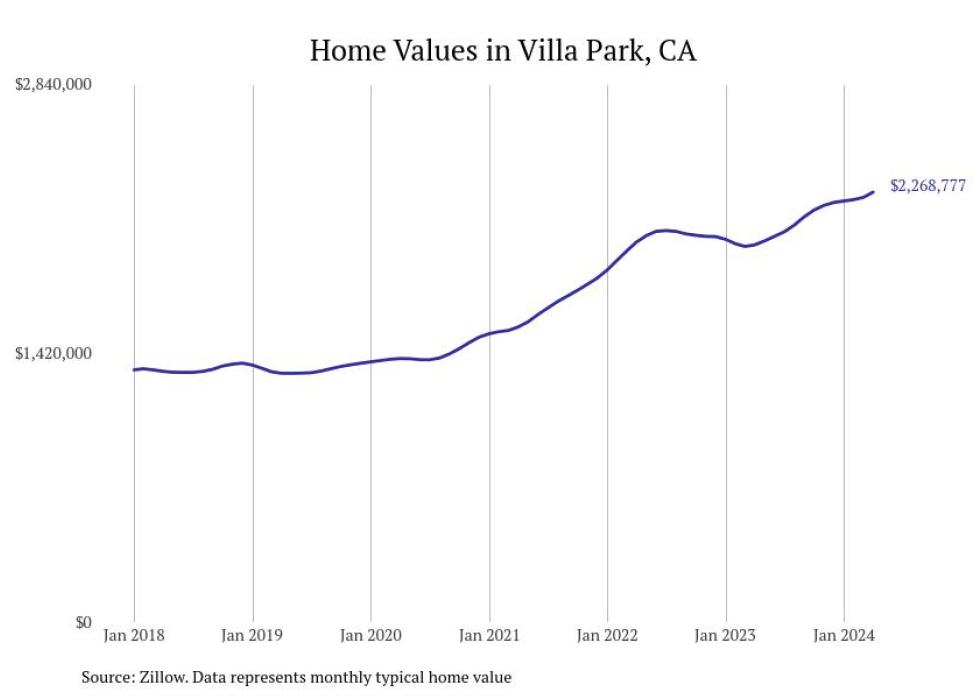
12. Villa Park
– Typical home value: $2,268,777
– 1-year price change: +14.0%
– 5-year price change: +72.8%
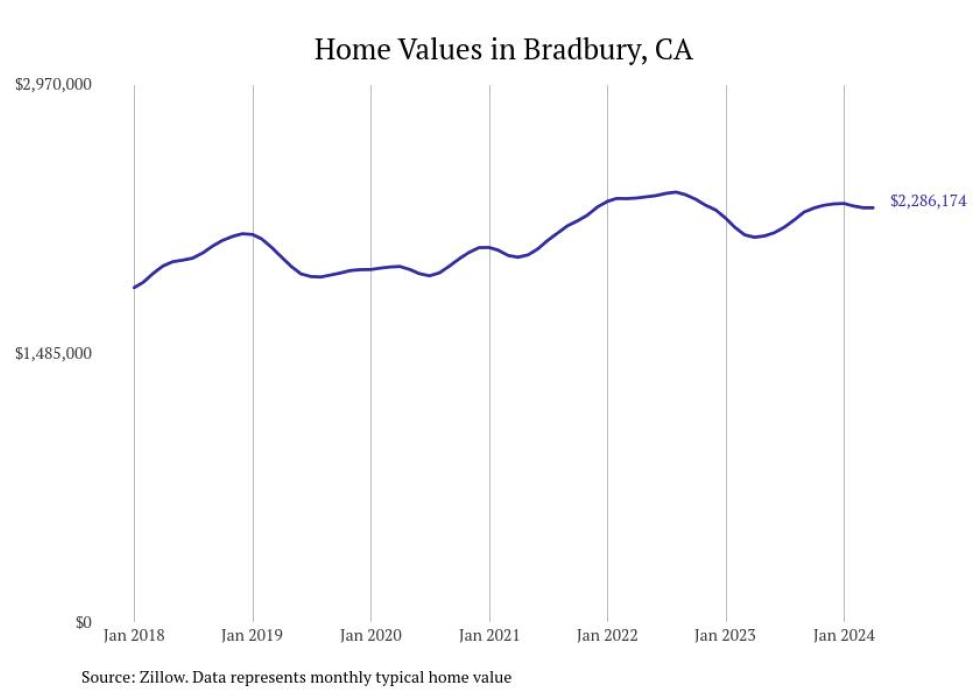
11. Bradbury
– Typical home value: $2,286,174
– 1-year price change: +7.7%
– 5-year price change: +13.4%
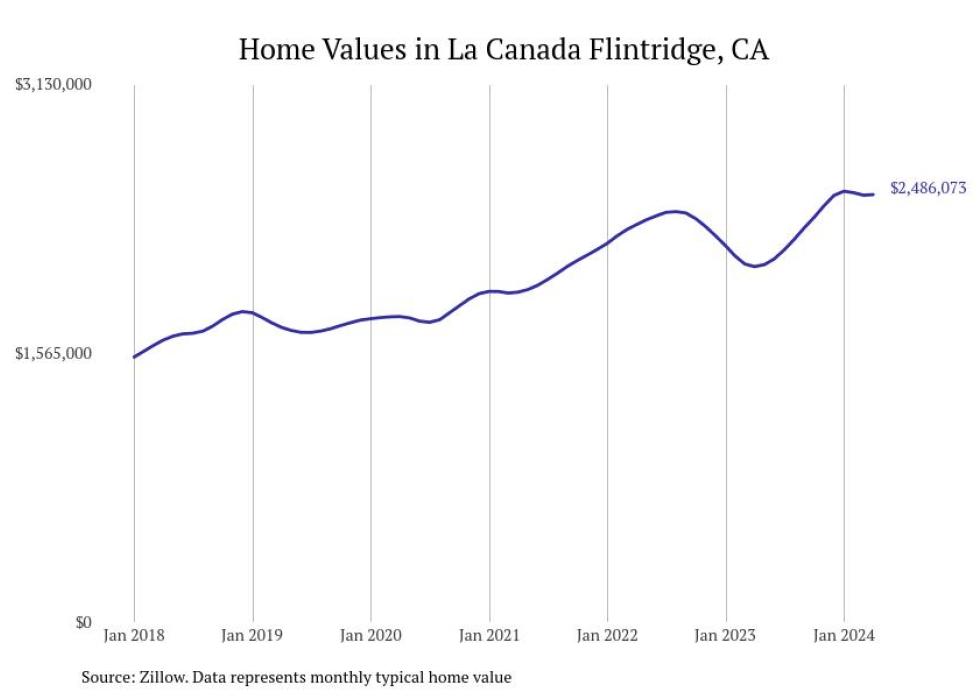
10. La Cañada Flintridge
– Typical home value: $2,486,073
– 1-year price change: +20.3%
– 5-year price change: +45.0%
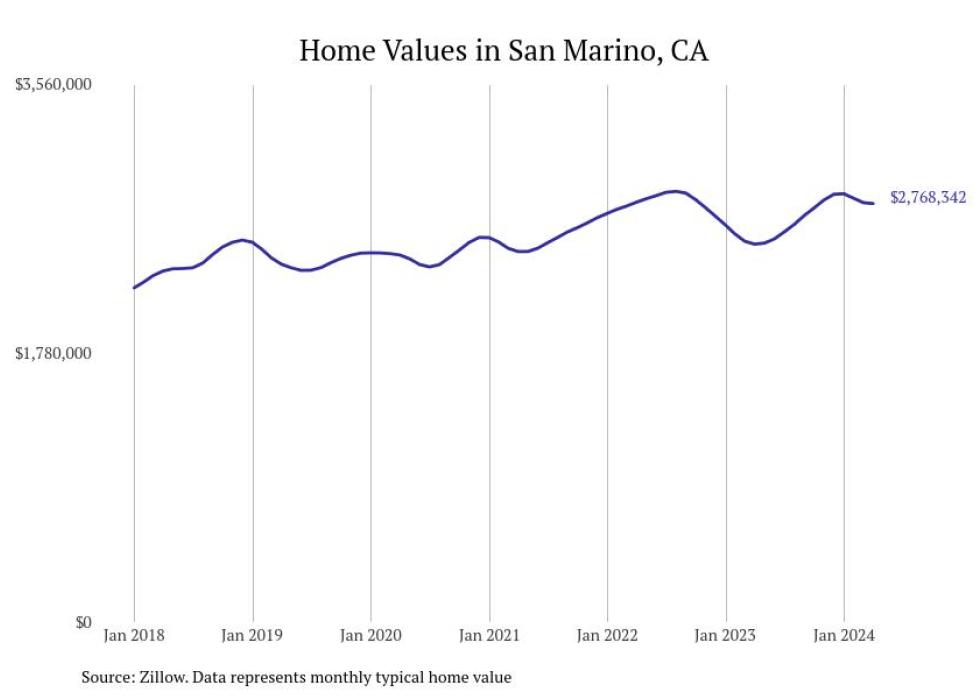
9. San Marino
– Typical home value: $2,768,342
– 1-year price change: +10.7%
– 5-year price change: +16.9%
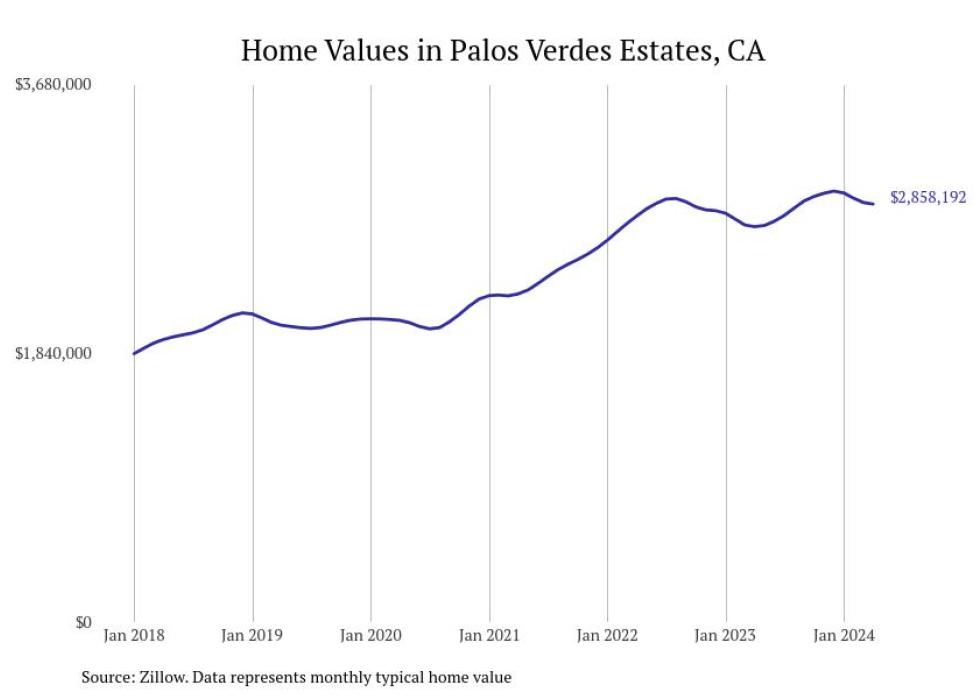
8. Palos Verdes Estates
– Typical home value: $2,858,192
– 1-year price change: +5.7%
– 5-year price change: +40.8%
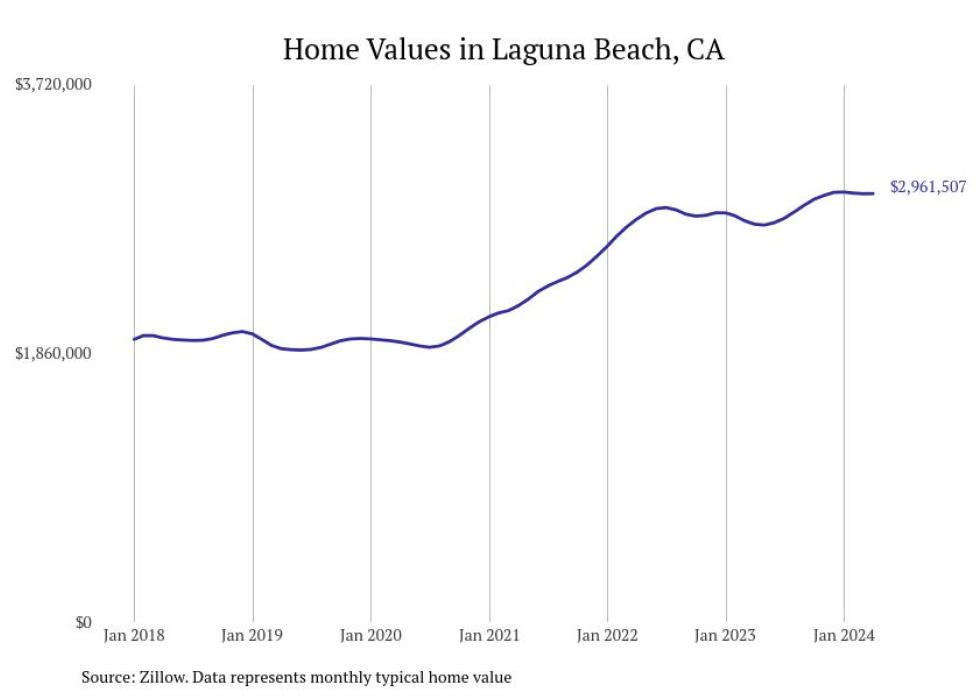
7. Laguna Beach
– Typical home value: $2,961,507
– 1-year price change: +7.7%
– 5-year price change: +56.7%

6. Manhattan Beach
– Typical home value: $3,081,776
– 1-year price change: +3.7%
– 5-year price change: +32.5%

5. Newport Beach
– Typical home value: $3,372,803
– 1-year price change: +12.8%
– 5-year price change: +68.3%
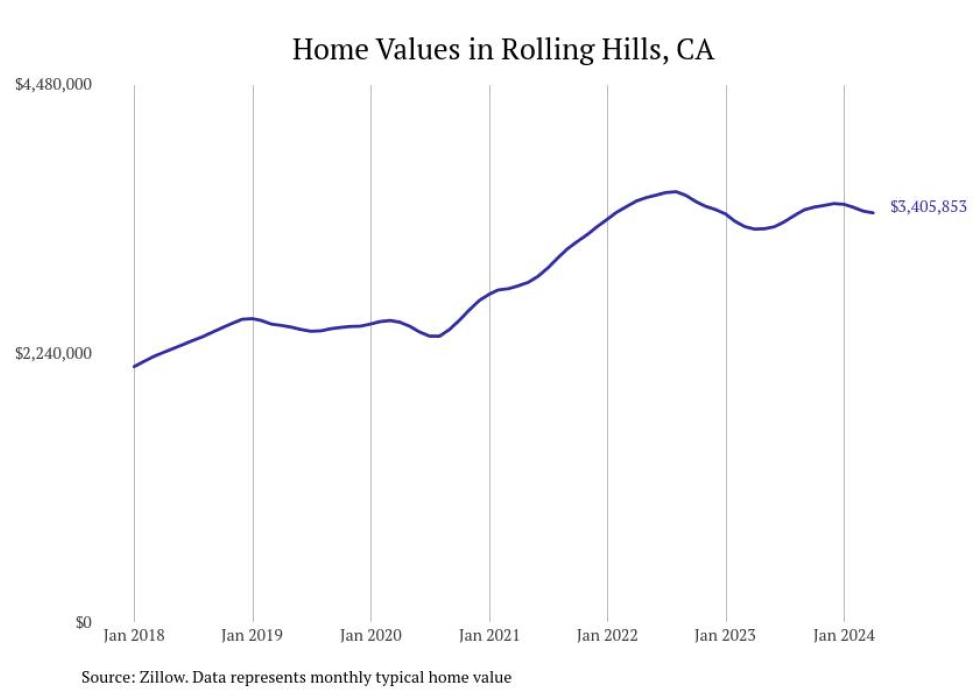
4. Rolling Hills
– Typical home value: $3,405,853
– 1-year price change: +4.1%
– 5-year price change: +37.9%
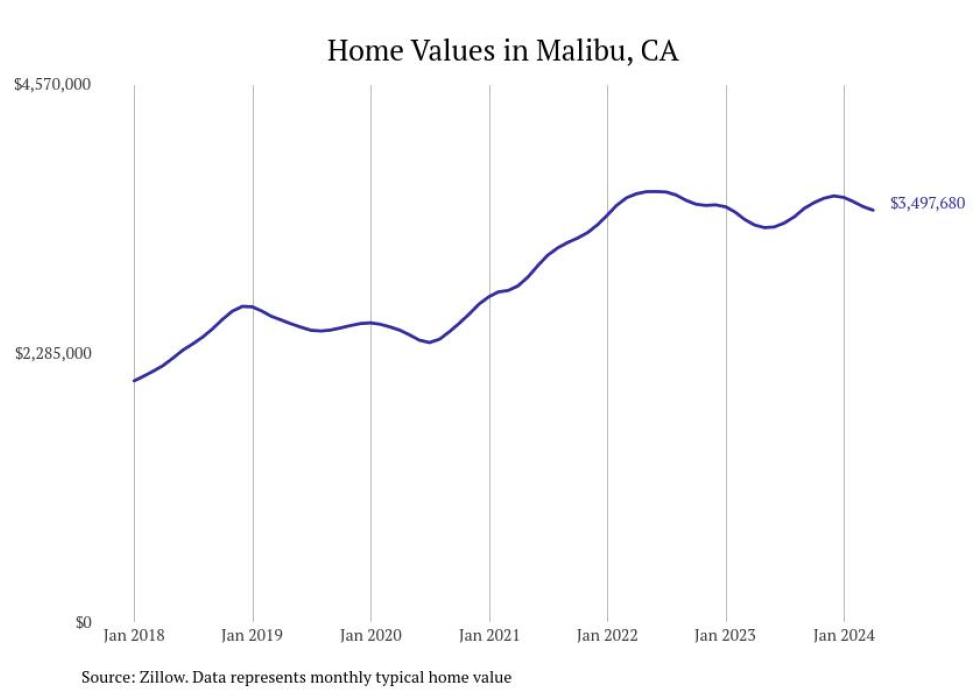
3. Malibu
– Typical home value: $3,497,680
– 1-year price change: +3.7%
– 5-year price change: +36.4%
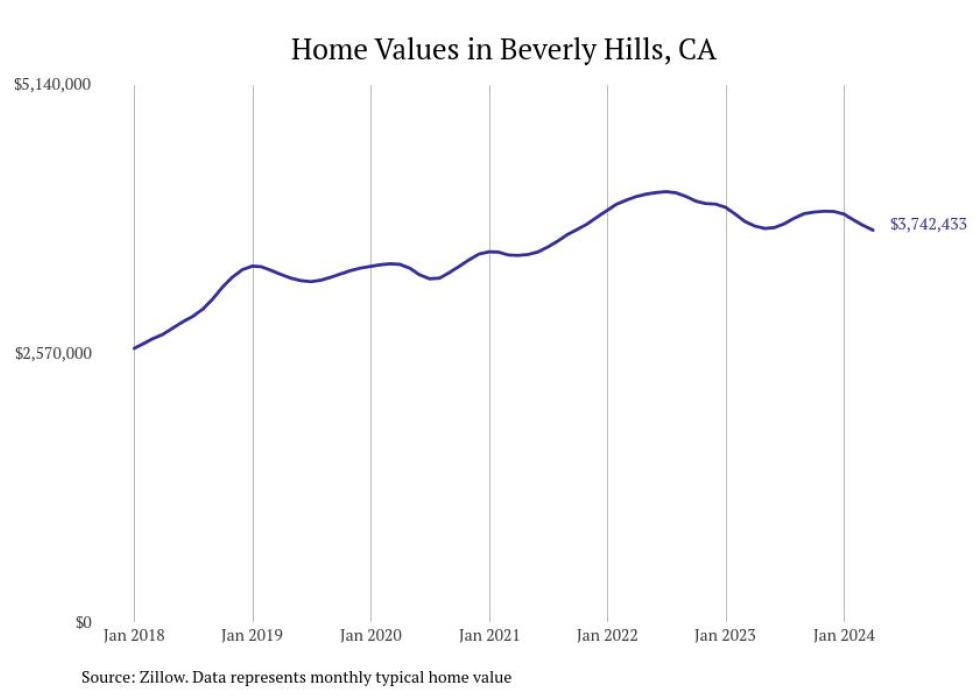
2. Beverly Hills
– Typical home value: $3,742,433
– 1-year price change: -1.1%
– 5-year price change: +12.8%
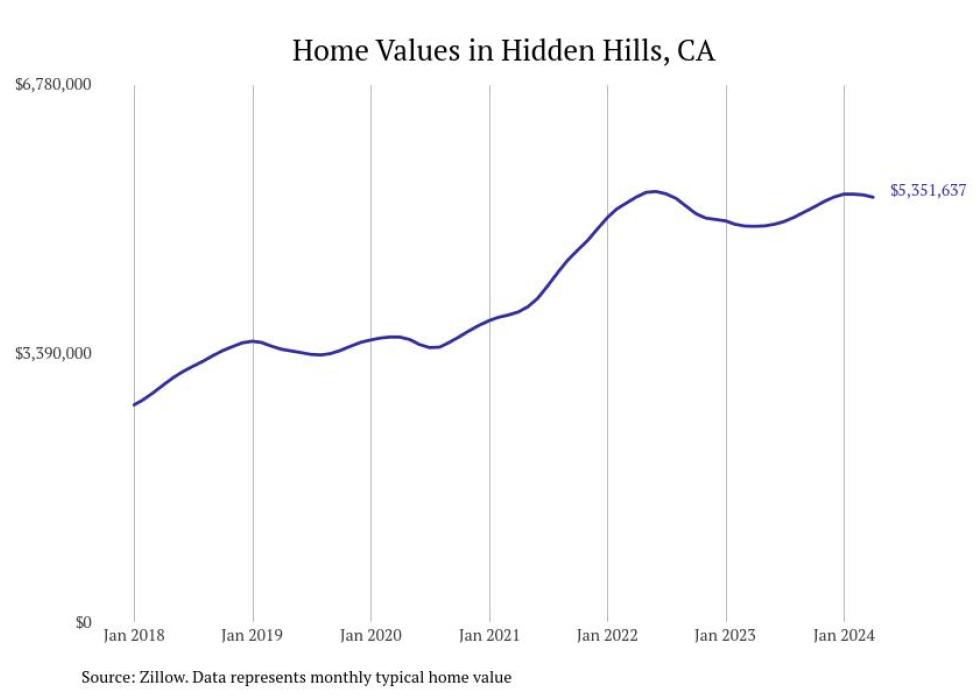
1. Hidden Hills
– Typical home value: $5,351,637
– 1-year price change: +7.3%
– 5-year price change: +55.7%
This story features data reporting and writing by Elena Cox and is part of a series utilizing data automation across 379 metros. The article was retitled and copy edited from its original version.
Re-published with CC BY-NC 4.0 License.