The real estate frenzy spurred by the coronavirus pandemic continues, though at a slower pace. Buyers in the Riverside metro area and many other places nationwide are still competing for a limited supply of housing, driving up prices for affordable properties.
In April, the typical home value in the United States was $359,402 — 4.4% higher than the year before.
Increasing mortgage rates have slowed growth, with prices even declining in some places. But some areas, including the following 30 cities in the Riverside metro area, are still seeing price jumps compared to the year before.
Using Zillow data, Stacker compiled a list of cities with the fastest-growing home prices in the Riverside metro area, which consists of cities in Riverside and San Bernardino counties. Cities are ranked by their one-year price change as of April 2024.
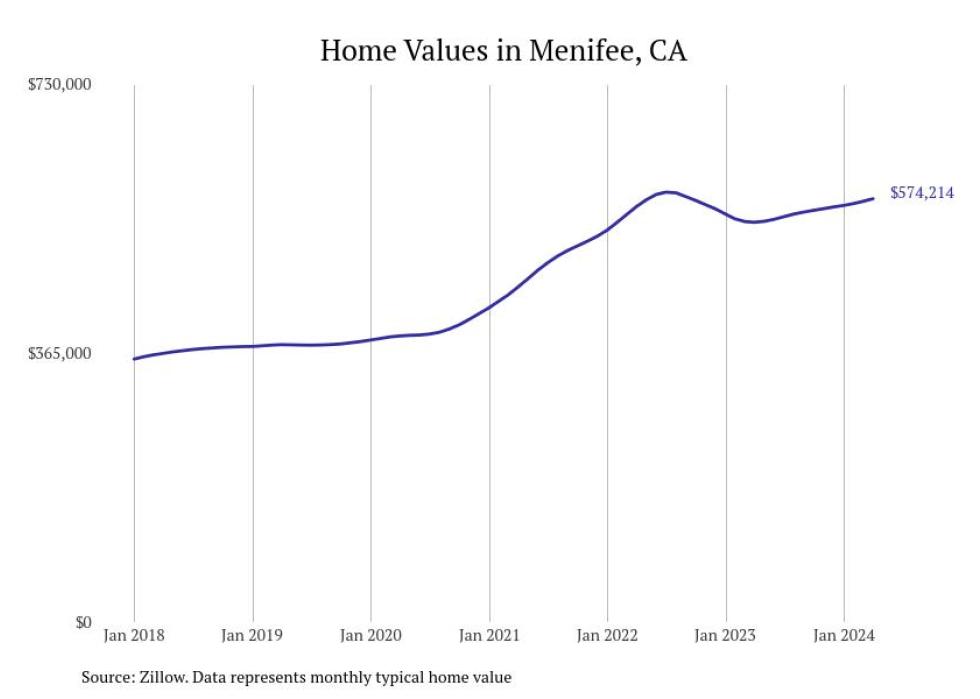
No. 30. Menifee
– 1-year price change: +$31,964 (+5.9%)
– 5-year price change: +$197,912 (+52.6%)
– Typical home value: $574,214 (28th most expensive city in metro)
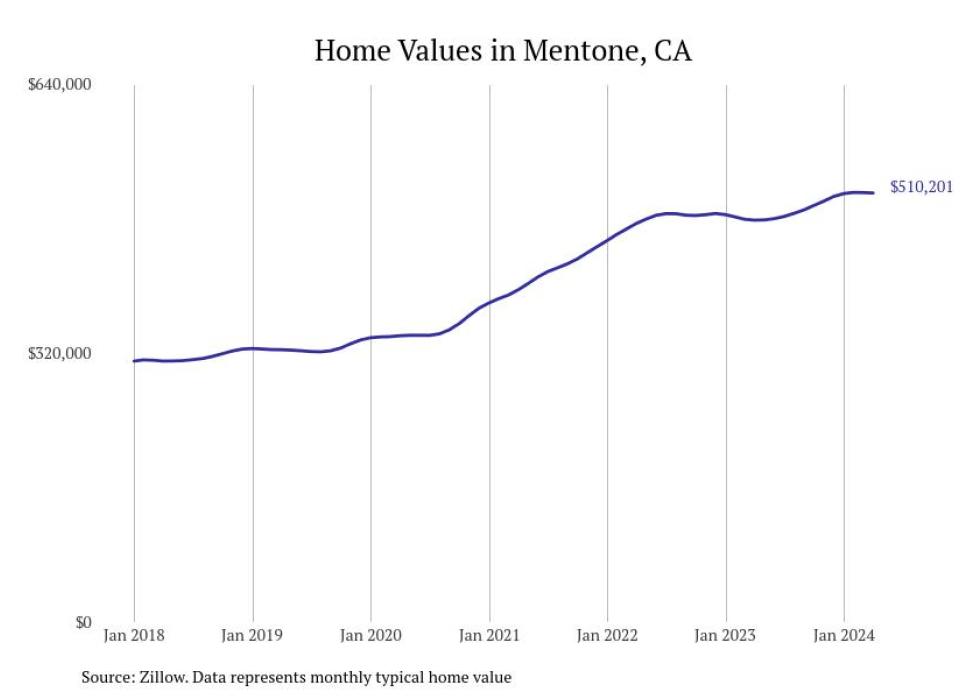
29. Mentone
– 1-year price change: +$32,252 (+6.7%)
– 5-year price change: +$186,306 (+57.5%)
– Typical home value: $510,201 (42nd most expensive city in metro)
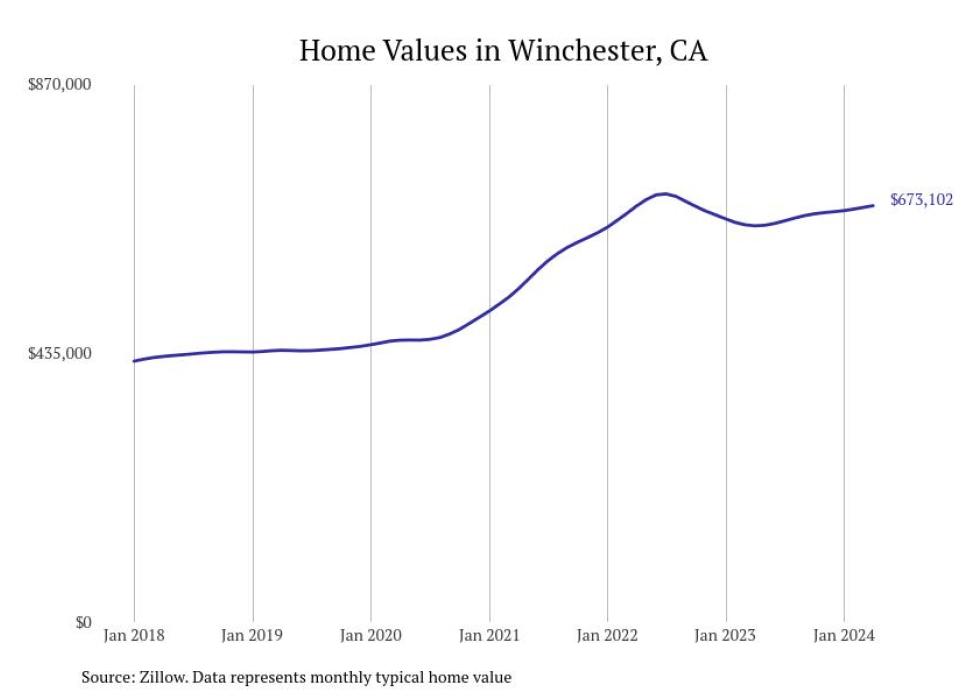
28. Winchester
– 1-year price change: +$32,527 (+5.1%)
– 5-year price change: +$233,711 (+53.2%)
– Typical home value: $673,102 (14th most expensive city in metro)
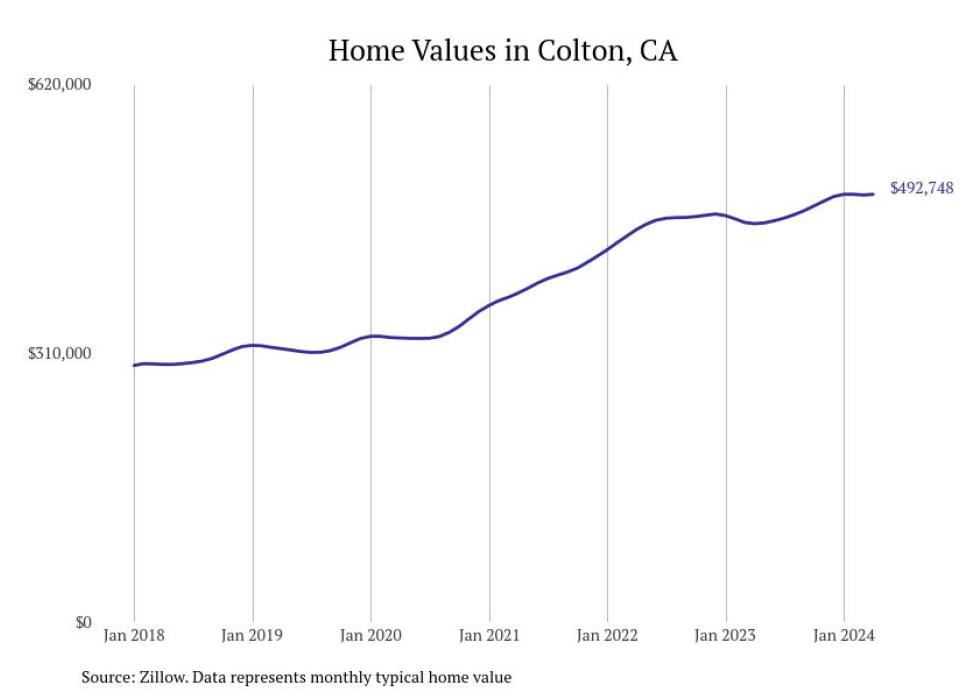
27. Colton
– 1-year price change: +$33,742 (+7.4%)
– 5-year price change: +$177,785 (+56.4%)
– Typical home value: $492,748 (45th most expensive city in metro)
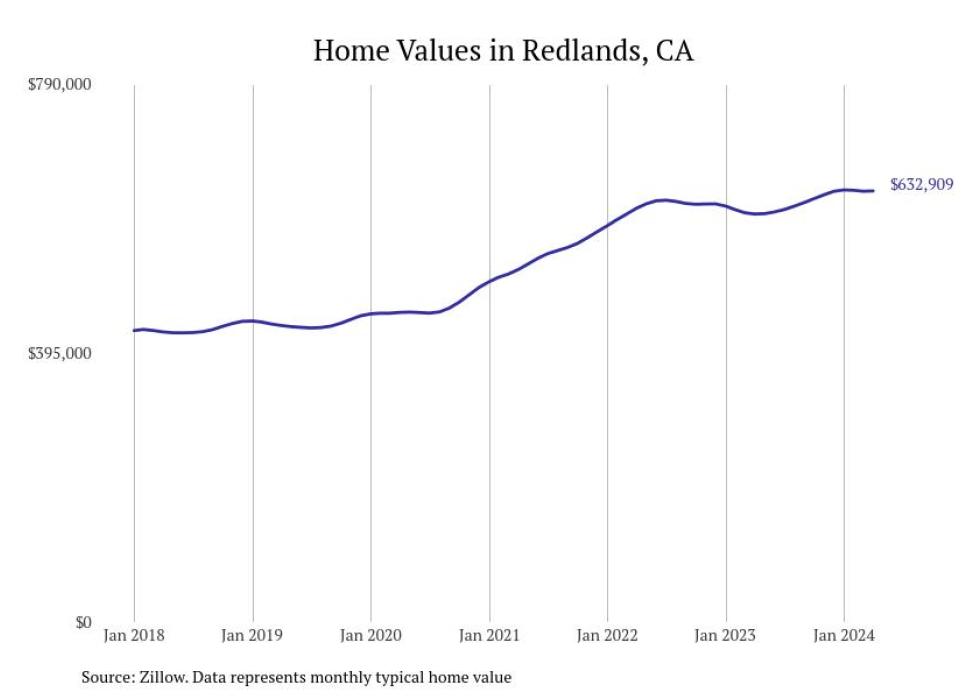
26. Redlands
– 1-year price change: +$33,964 (+5.7%)
– 5-year price change: +$197,534 (+45.4%)
– Typical home value: $632,909 (22nd most expensive city in metro)

25. Yucaipa
– 1-year price change: +$35,264 (+6.6%)
– 5-year price change: +$182,287 (+47.1%)
– Typical home value: $569,662 (30th most expensive city in metro)
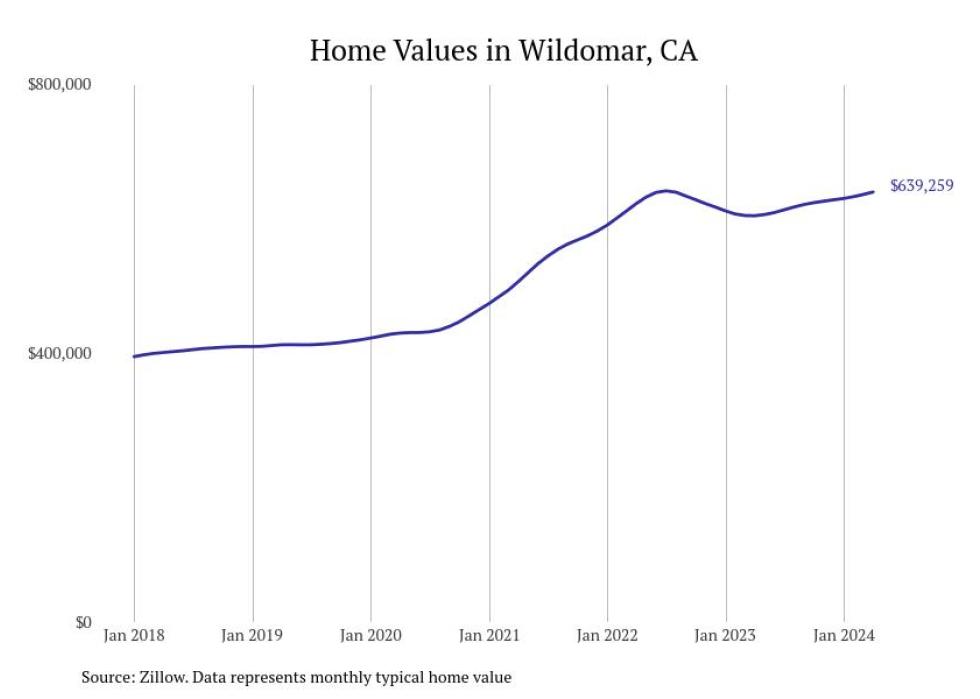
24. Wildomar
– 1-year price change: +$35,283 (+5.8%)
– 5-year price change: +$227,050 (+55.1%)
– Typical home value: $639,259 (19th most expensive city in metro)
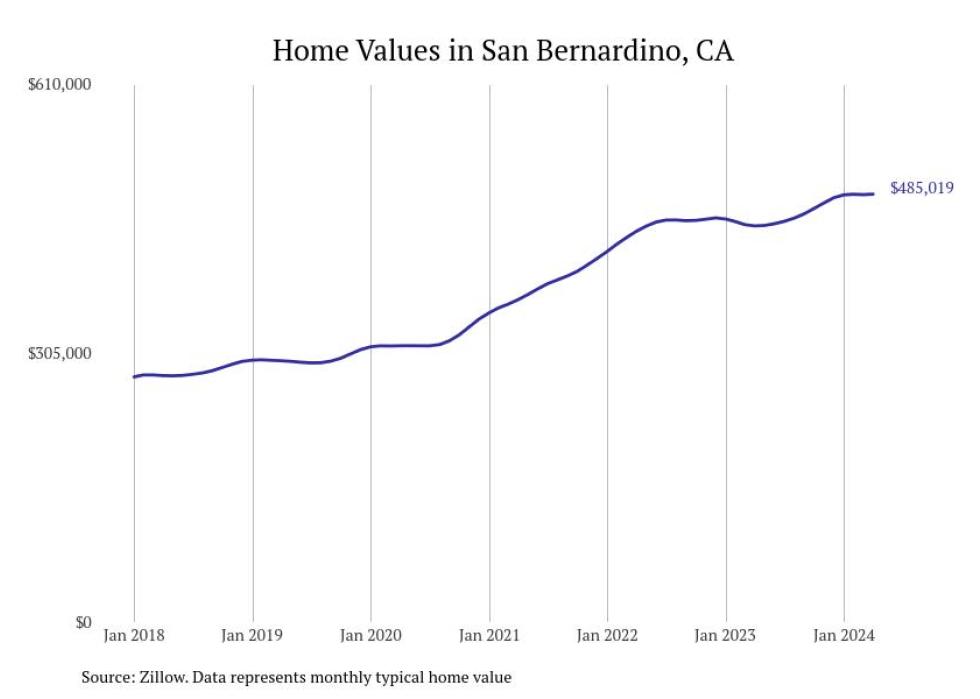
23. San Bernardino
– 1-year price change: +$35,965 (+8.0%)
– 5-year price change: +$188,811 (+63.7%)
– Typical home value: $485,019 (46th most expensive city in metro)
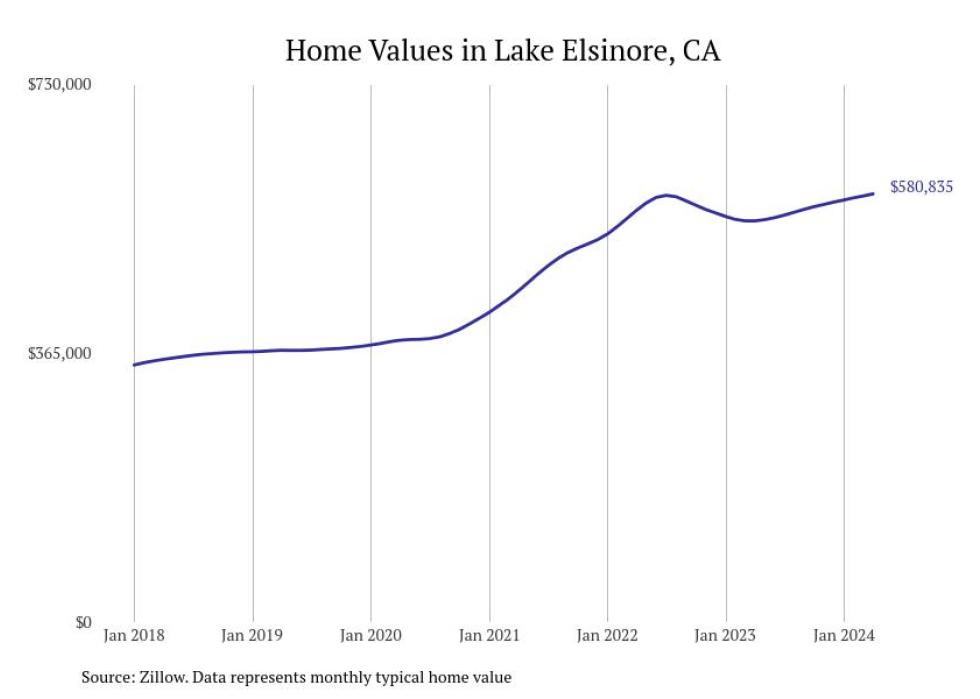
22. Lake Elsinore
– 1-year price change: +$36,720 (+6.7%)
– 5-year price change: +$212,130 (+57.5%)
– Typical home value: $580,835 (25th most expensive city in metro)
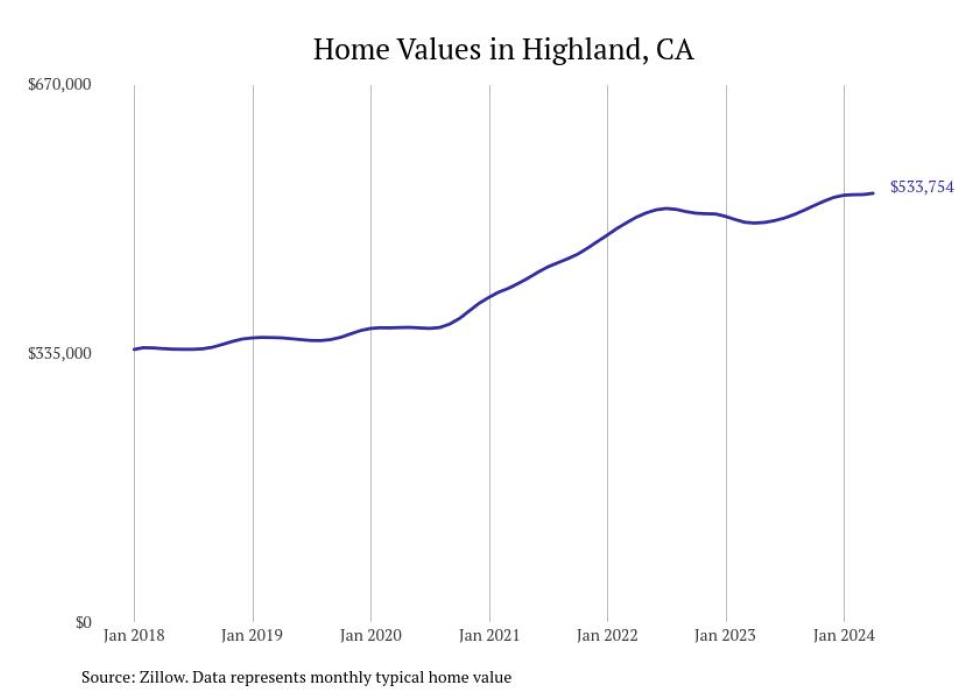
21. Highland
– 1-year price change: +$37,015 (+7.5%)
– 5-year price change: +$179,886 (+50.8%)
– Typical home value: $533,754 (38th most expensive city in metro)
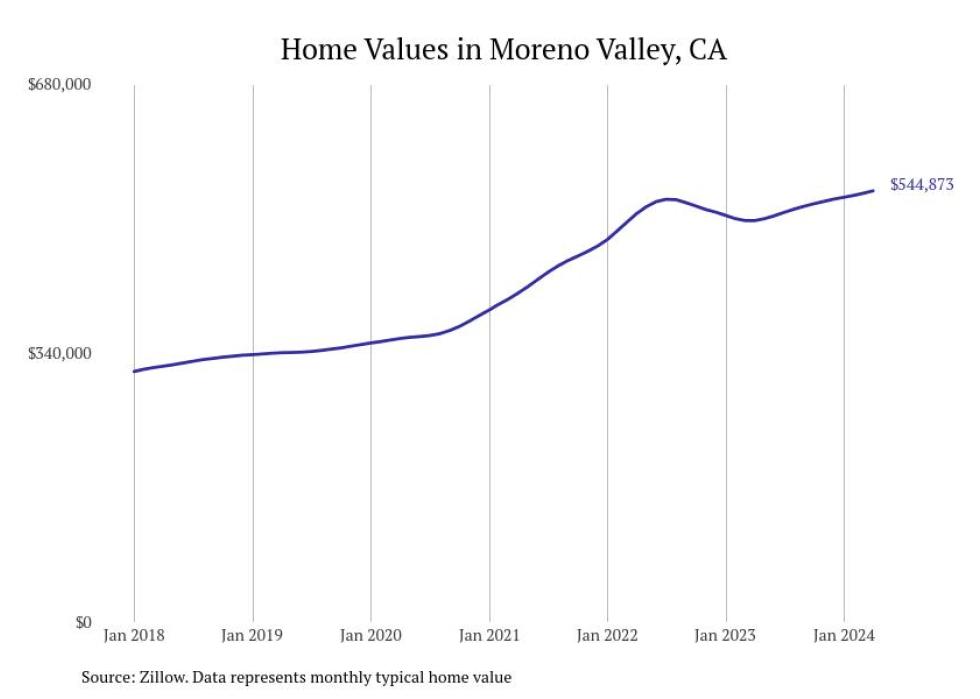
20. Moreno Valley
– 1-year price change: +$37,681 (+7.4%)
– 5-year price change: +$204,520 (+60.1%)
– Typical home value: $544,873 (37th most expensive city in metro)

19. Loma Linda
– 1-year price change: +$40,303 (+6.8%)
– 5-year price change: +$200,201 (+46.2%)
– Typical home value: $633,508 (21st most expensive city in metro)
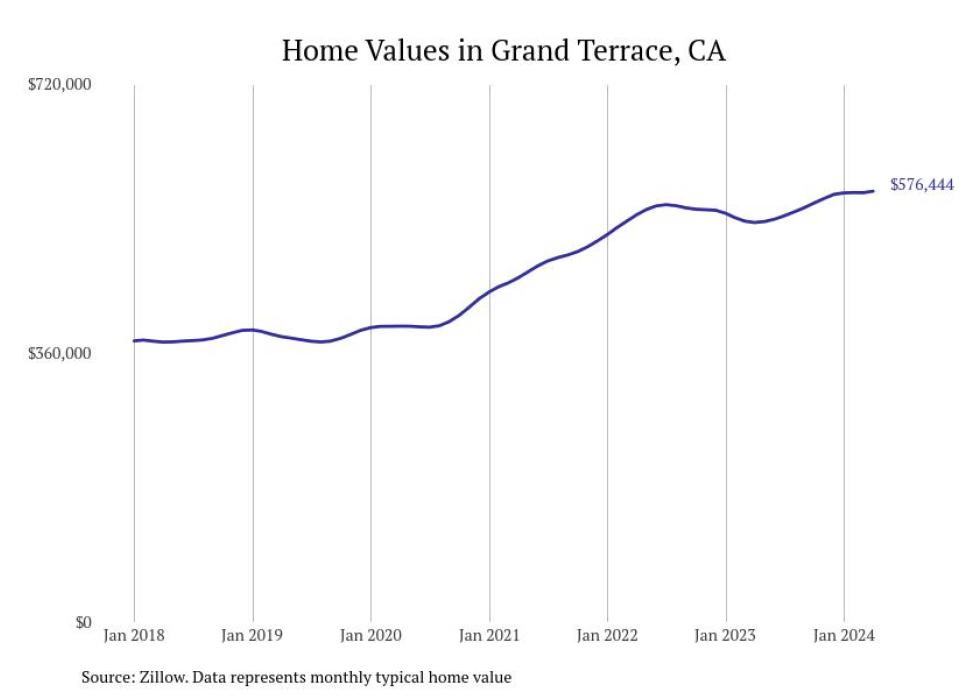
18. Grand Terrace
– 1-year price change: +$41,890 (+7.8%)
– 5-year price change: +$194,502 (+50.9%)
– Typical home value: $576,444 (27th most expensive city in metro)
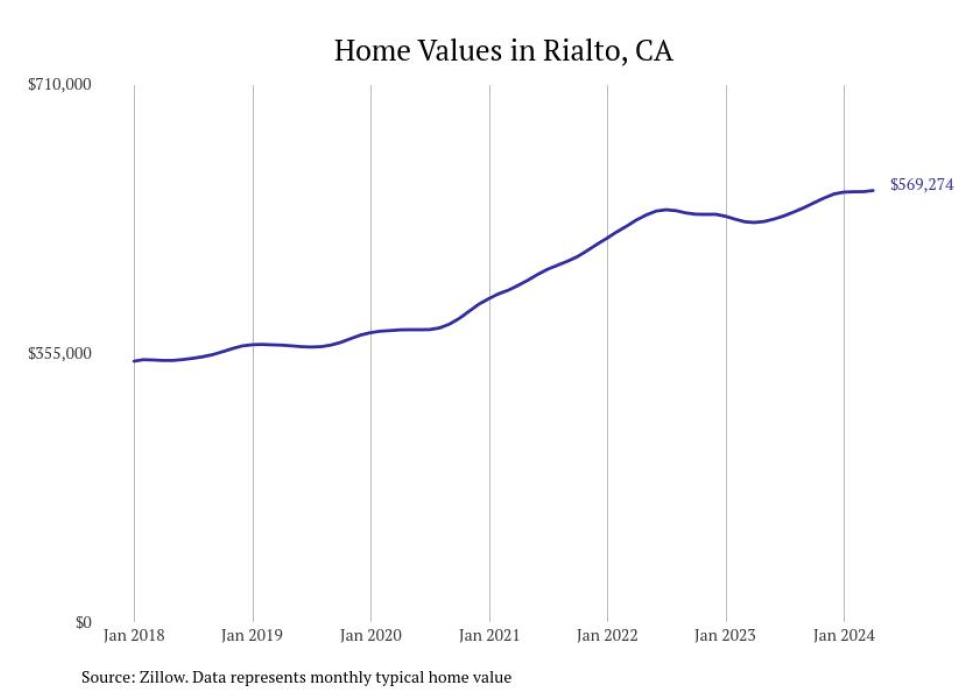
17. Rialto
– 1-year price change: +$42,143 (+8.0%)
– 5-year price change: +$203,893 (+55.8%)
– Typical home value: $569,274 (31st most expensive city in metro)
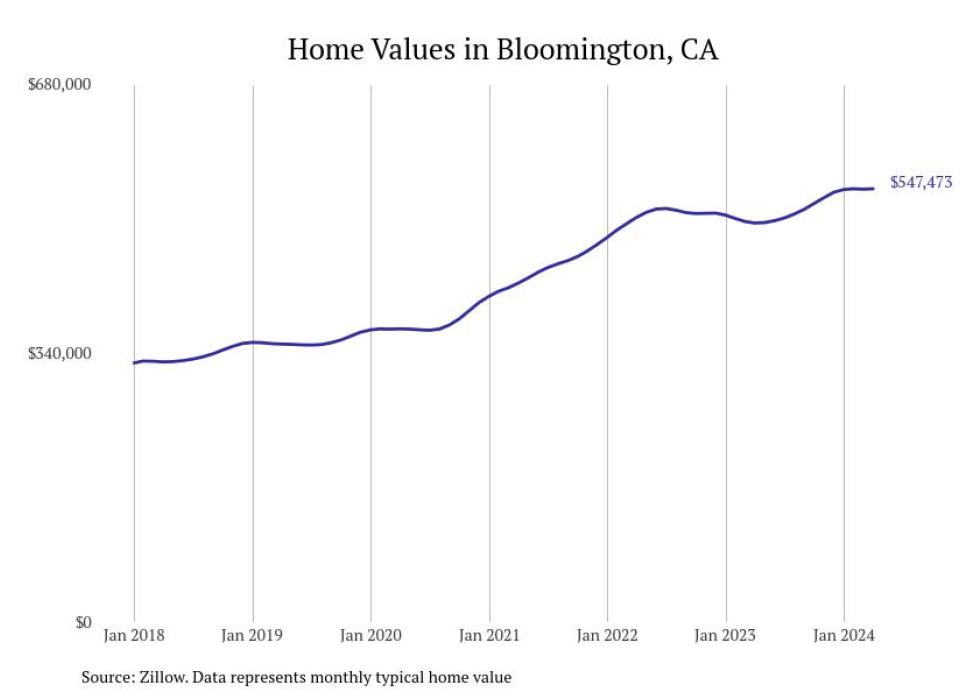
16. Bloomington
– 1-year price change: +$43,229 (+8.6%)
– 5-year price change: +$196,175 (+55.8%)
– Typical home value: $547,473 (36th most expensive city in metro)
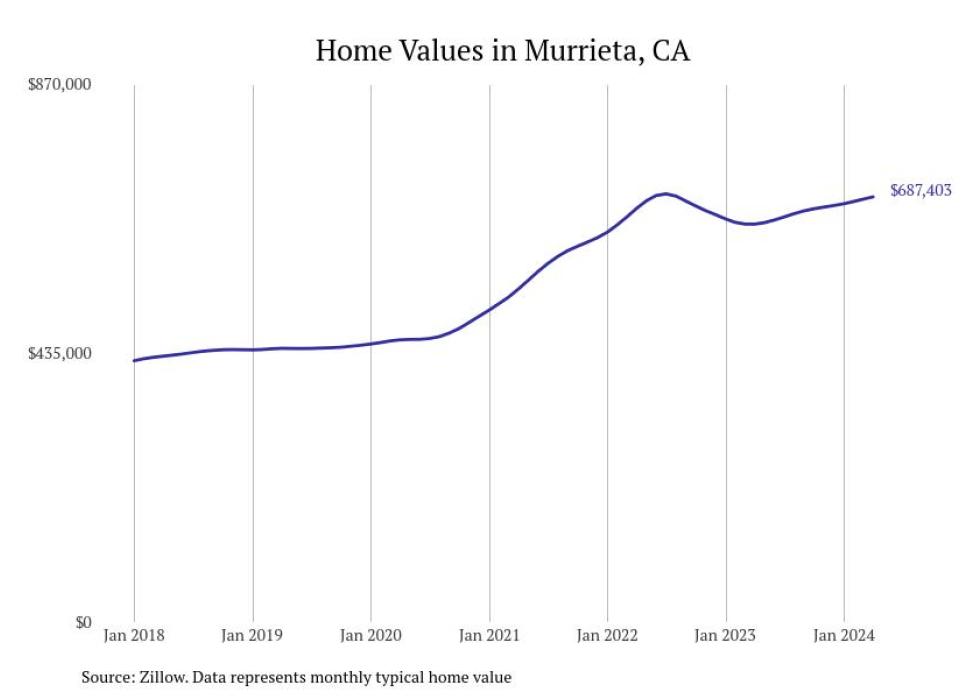
15. Murrieta
– 1-year price change: +$44,113 (+6.9%)
– 5-year price change: +$244,921 (+55.4%)
– Typical home value: $687,403 (13th most expensive city in metro)
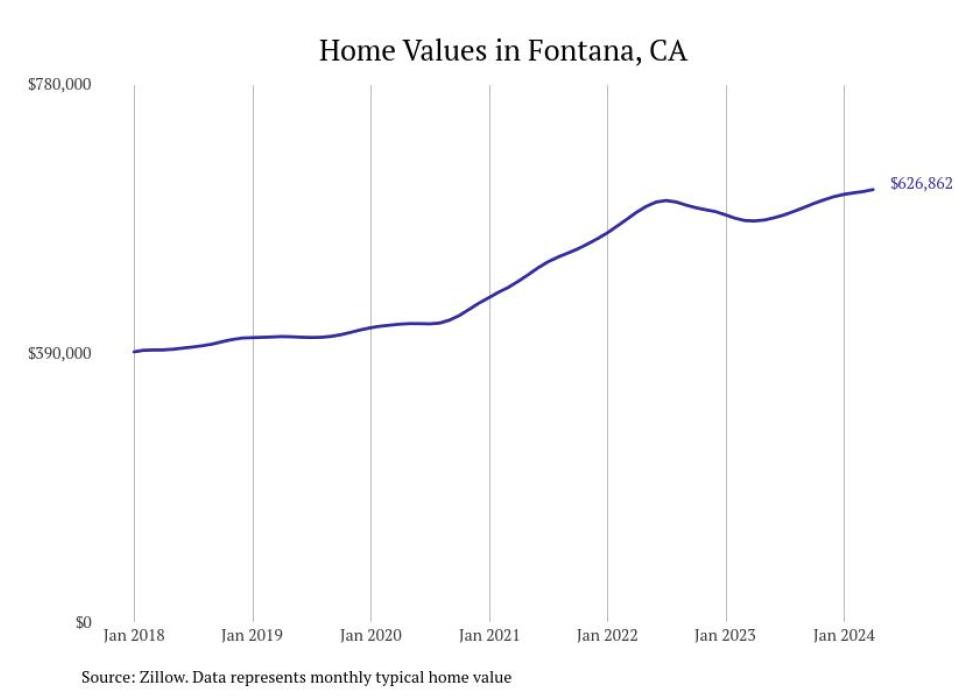
14. Fontana
– 1-year price change: +$45,585 (+7.8%)
– 5-year price change: +$213,018 (+51.5%)
– Typical home value: $626,862 (23rd most expensive city in metro)

13. Montclair
– 1-year price change: +$48,358 (+8.0%)
– 5-year price change: +$222,252 (+51.3%)
– Typical home value: $655,075 (17th most expensive city in metro)

12. Ontario
– 1-year price change: +$49,797 (+8.5%)
– 5-year price change: +$221,469 (+53.1%)
– Typical home value: $638,744 (20th most expensive city in metro)
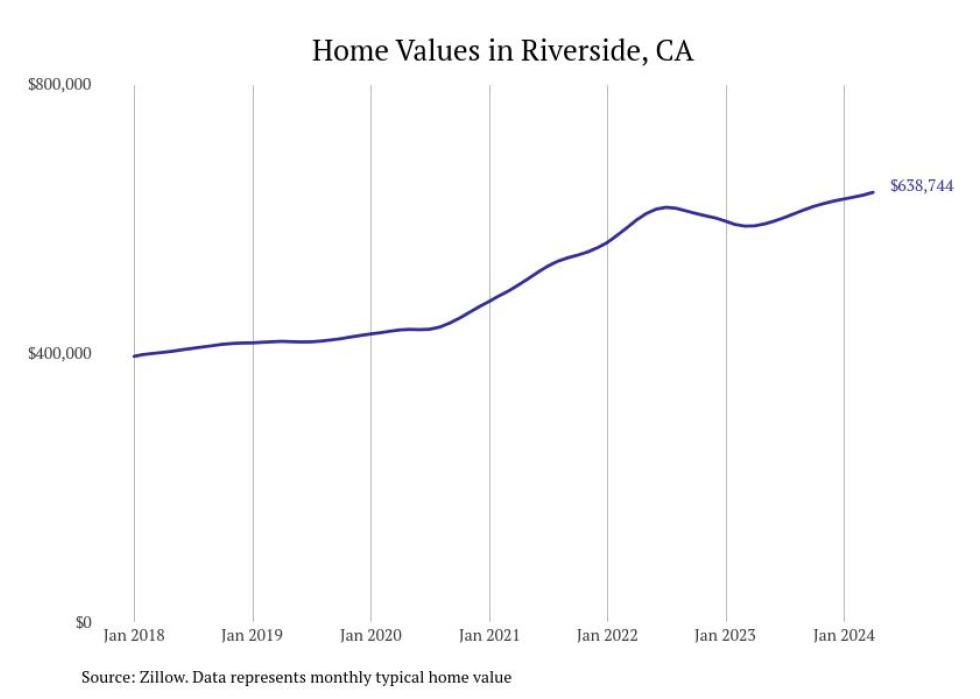
11. Riverside
– 1-year price change: +$49,278 (+8.0%)
– 5-year price change: +$223,077 (+50.3%)
– Typical home value: $666,999 (16th most expensive city in metro)
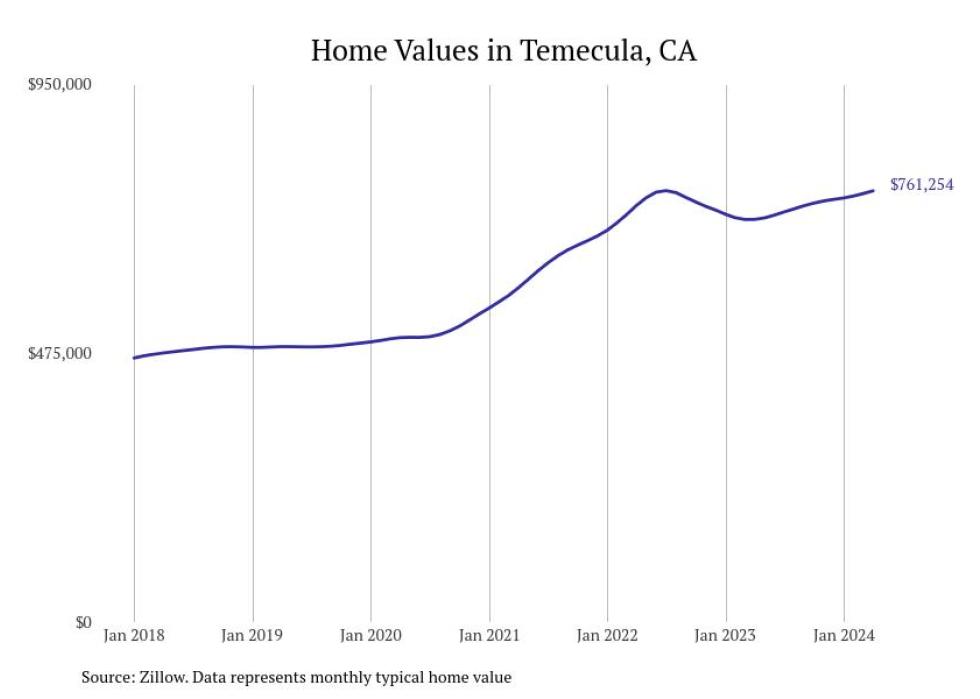
10. Temecula
– 1-year price change: +$50,491 (+7.1%)
– 5-year price change: +$274,975 (+56.5%)
– Typical home value: $761,254 (9th most expensive city in metro)
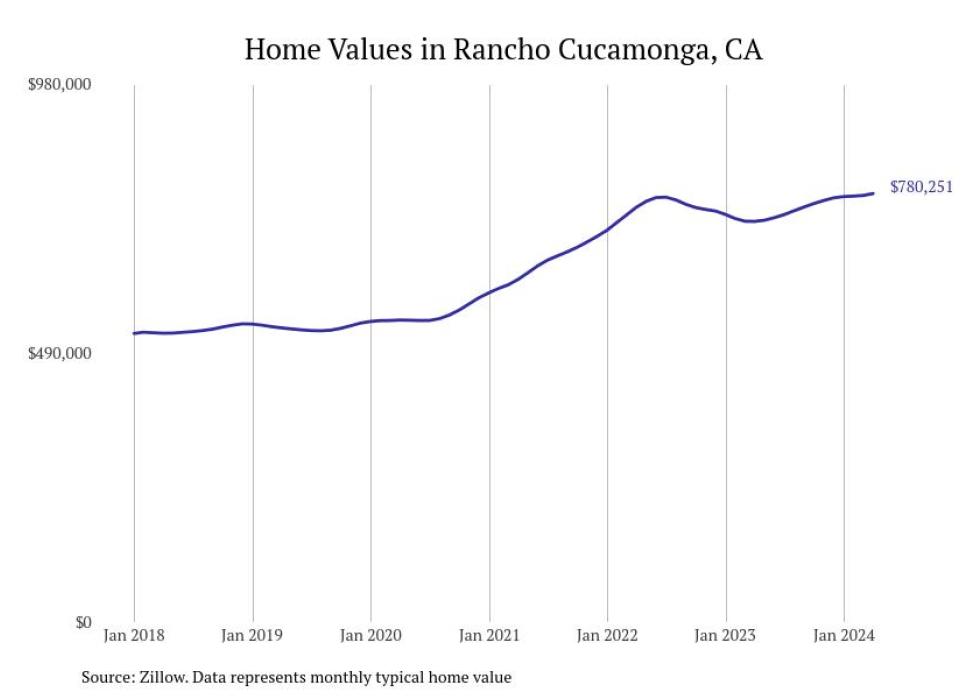
9. Rancho Cucamonga
– 1-year price change: +$50,687 (+6.9%)
– 5-year price change: +$244,475 (+45.6%)
– Typical home value: $780,251 (7th most expensive city in metro)
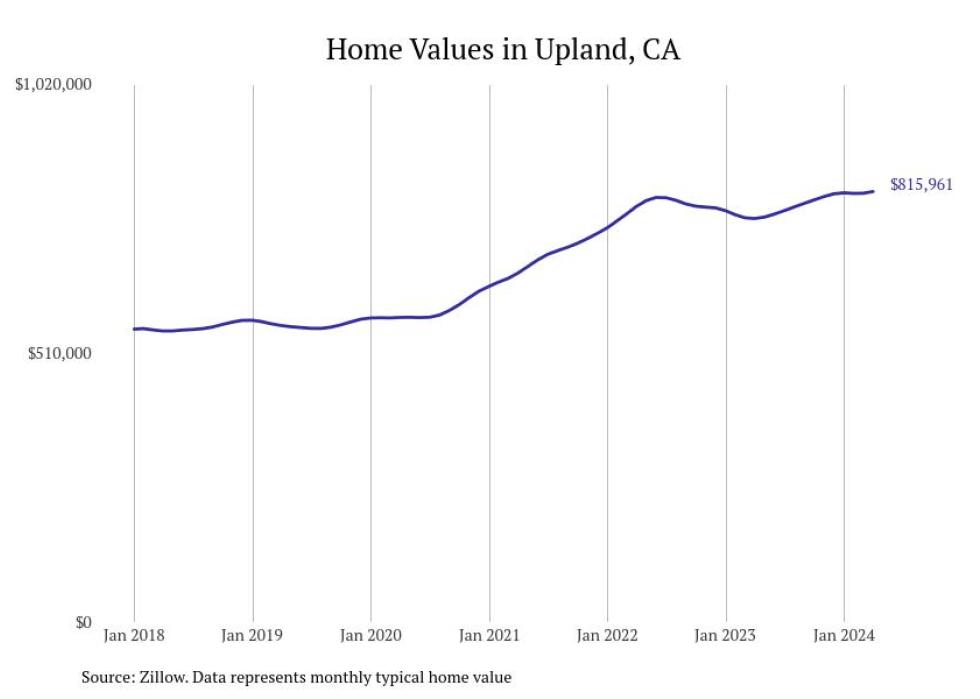
8. Upland
– 1-year price change: +$51,154 (+6.7%)
– 5-year price change: +$253,903 (+45.2%)
– Typical home value: $815,961 (6th most expensive city in metro)

7. Jurupa Valley
– 1-year price change: +$52,096 (+8.6%)
– 5-year price change: +$234,766 (+55.9%)
– Typical home value: $654,640 (18th most expensive city in metro)
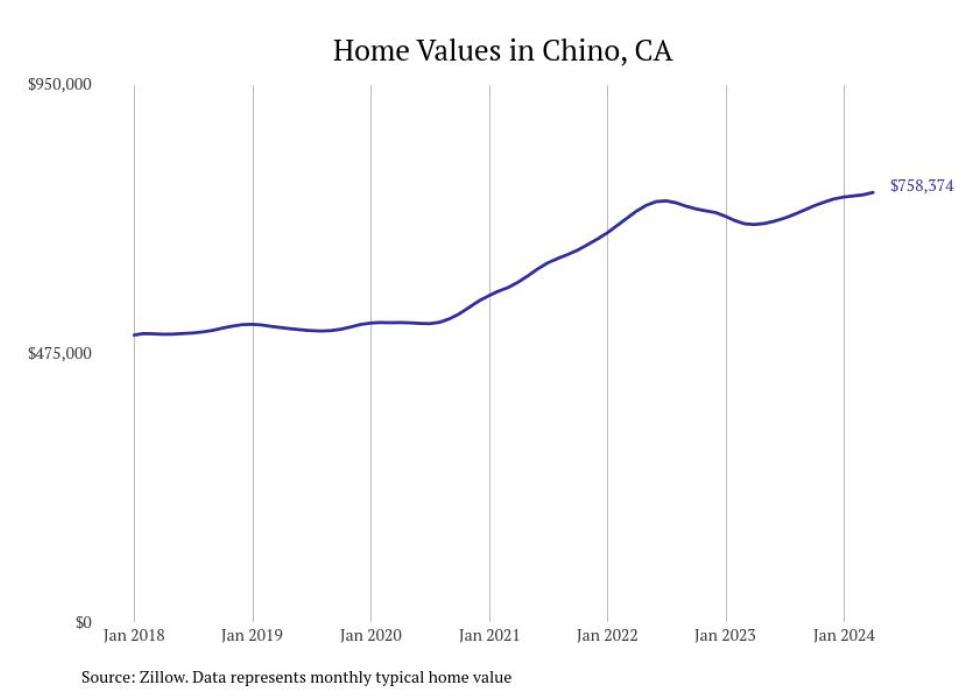
6. Chino
– 1-year price change: +$56,562 (+8.1%)
– 5-year price change: +$238,622 (+45.9%)
– Typical home value: $758,374 (10th most expensive city in metro)
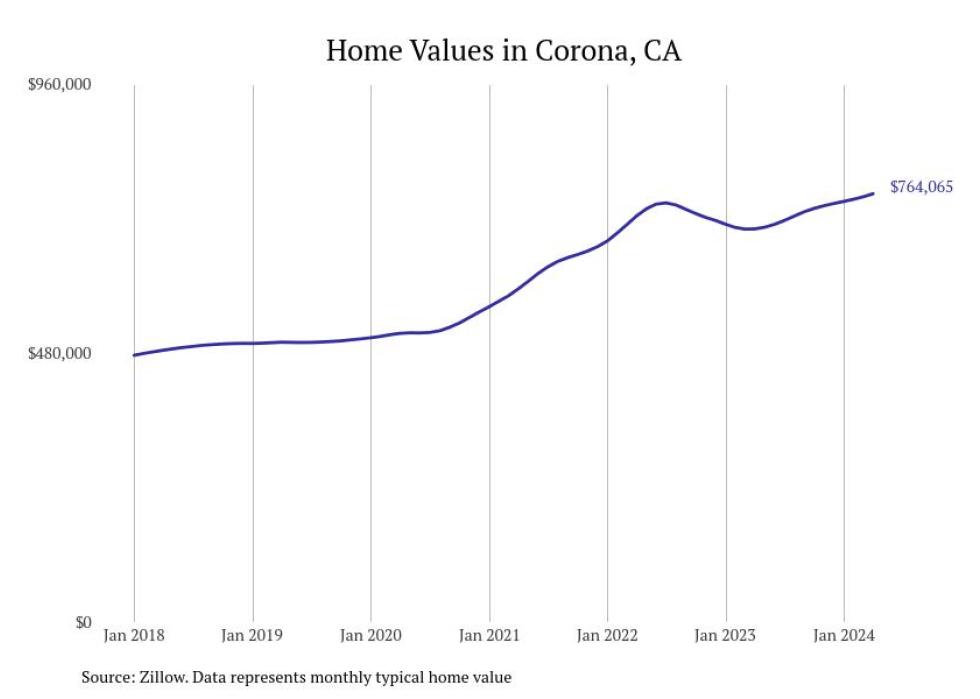
5. Corona
– 1-year price change: +$62,851 (+9.0%)
– 5-year price change: +$264,835 (+53.0%)
– Typical home value: $764,065 (8th most expensive city in metro)
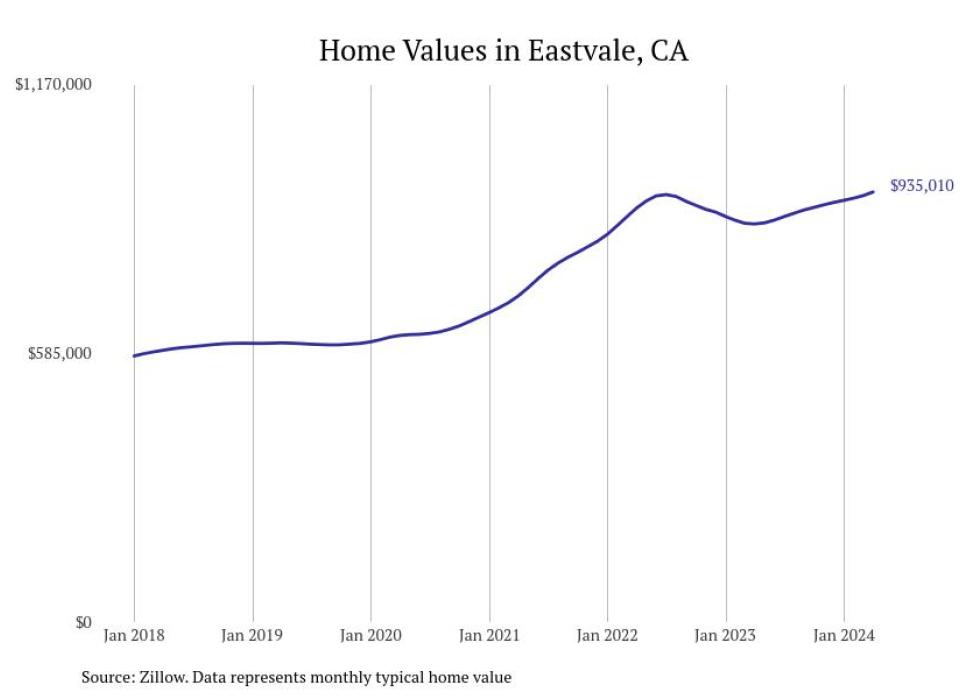
4. Eastvale
– 1-year price change: +$69,426 (+8.0%)
– 5-year price change: +$327,959 (+54.0%)
– Typical home value: $935,010 (3rd most expensive city in metro)
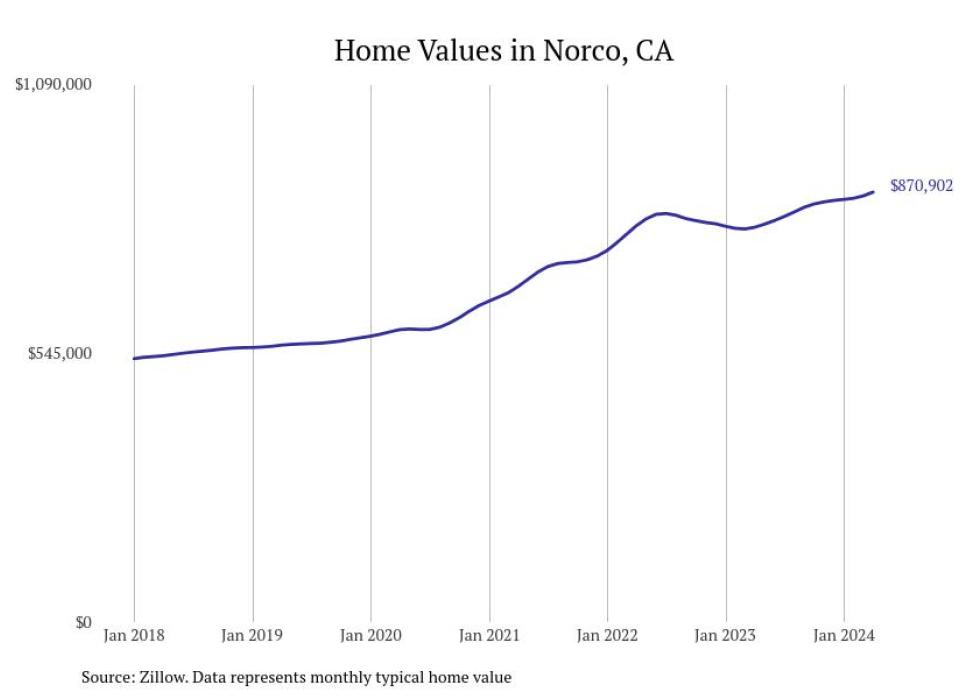
3. Norco
– 1-year price change: +$71,464 (+8.9%)
– 5-year price change: +$310,074 (+55.3%)
– Typical home value: $870,902 (5th most expensive city in metro)
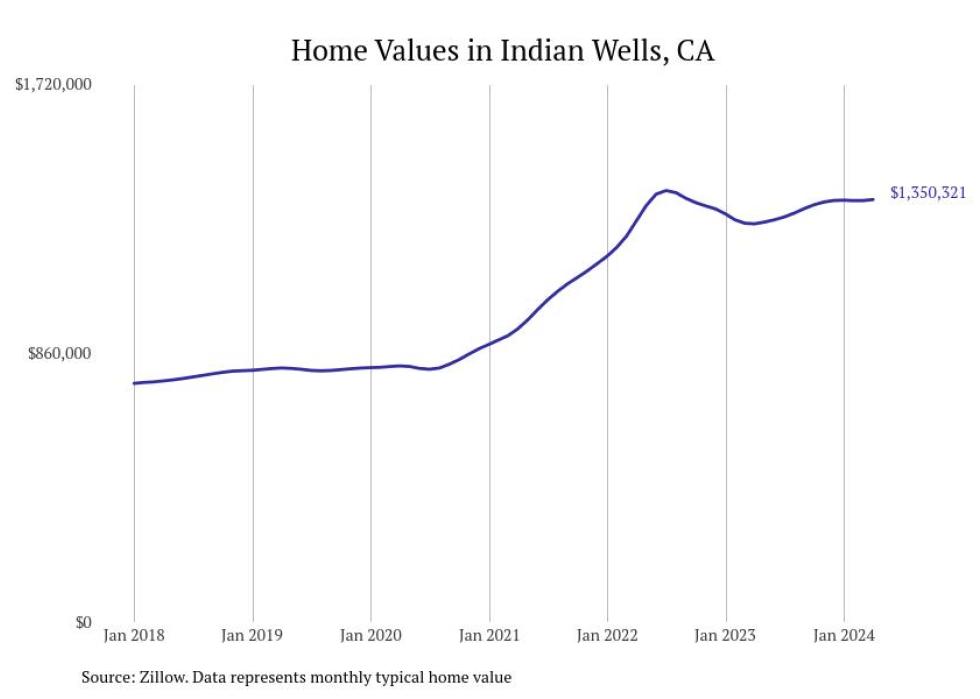
2. Indian Wells
– 1-year price change: +$77,473 (+6.1%)
– 5-year price change: +$538,247 (+66.3%)
– Typical home value: $1,350,321 (1st most expensive city in metro)
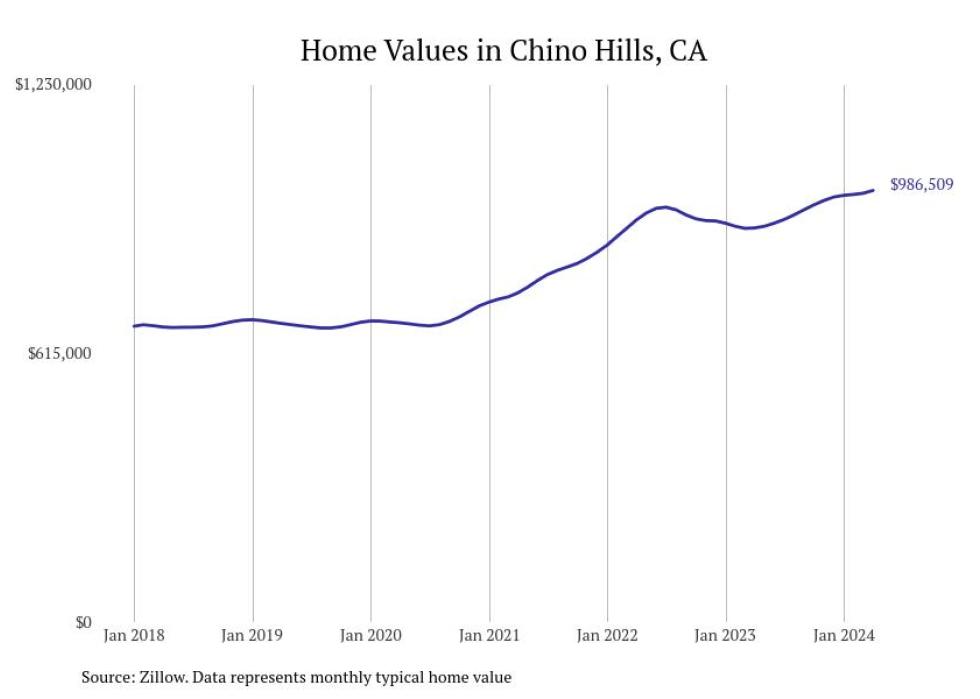
1. Chino Hills
– 1-year price change: +$85,817 (+9.5%)
– 5-year price change: +$303,881 (+44.5%)
– Typical home value: $986,509 (2nd most expensive city in metro)
This story features data reporting and writing by Elena Cox and is part of a series utilizing data automation across 380 metros. The article was copy edited from its original version.
Re-published with CC BY-NC 4.0 License.