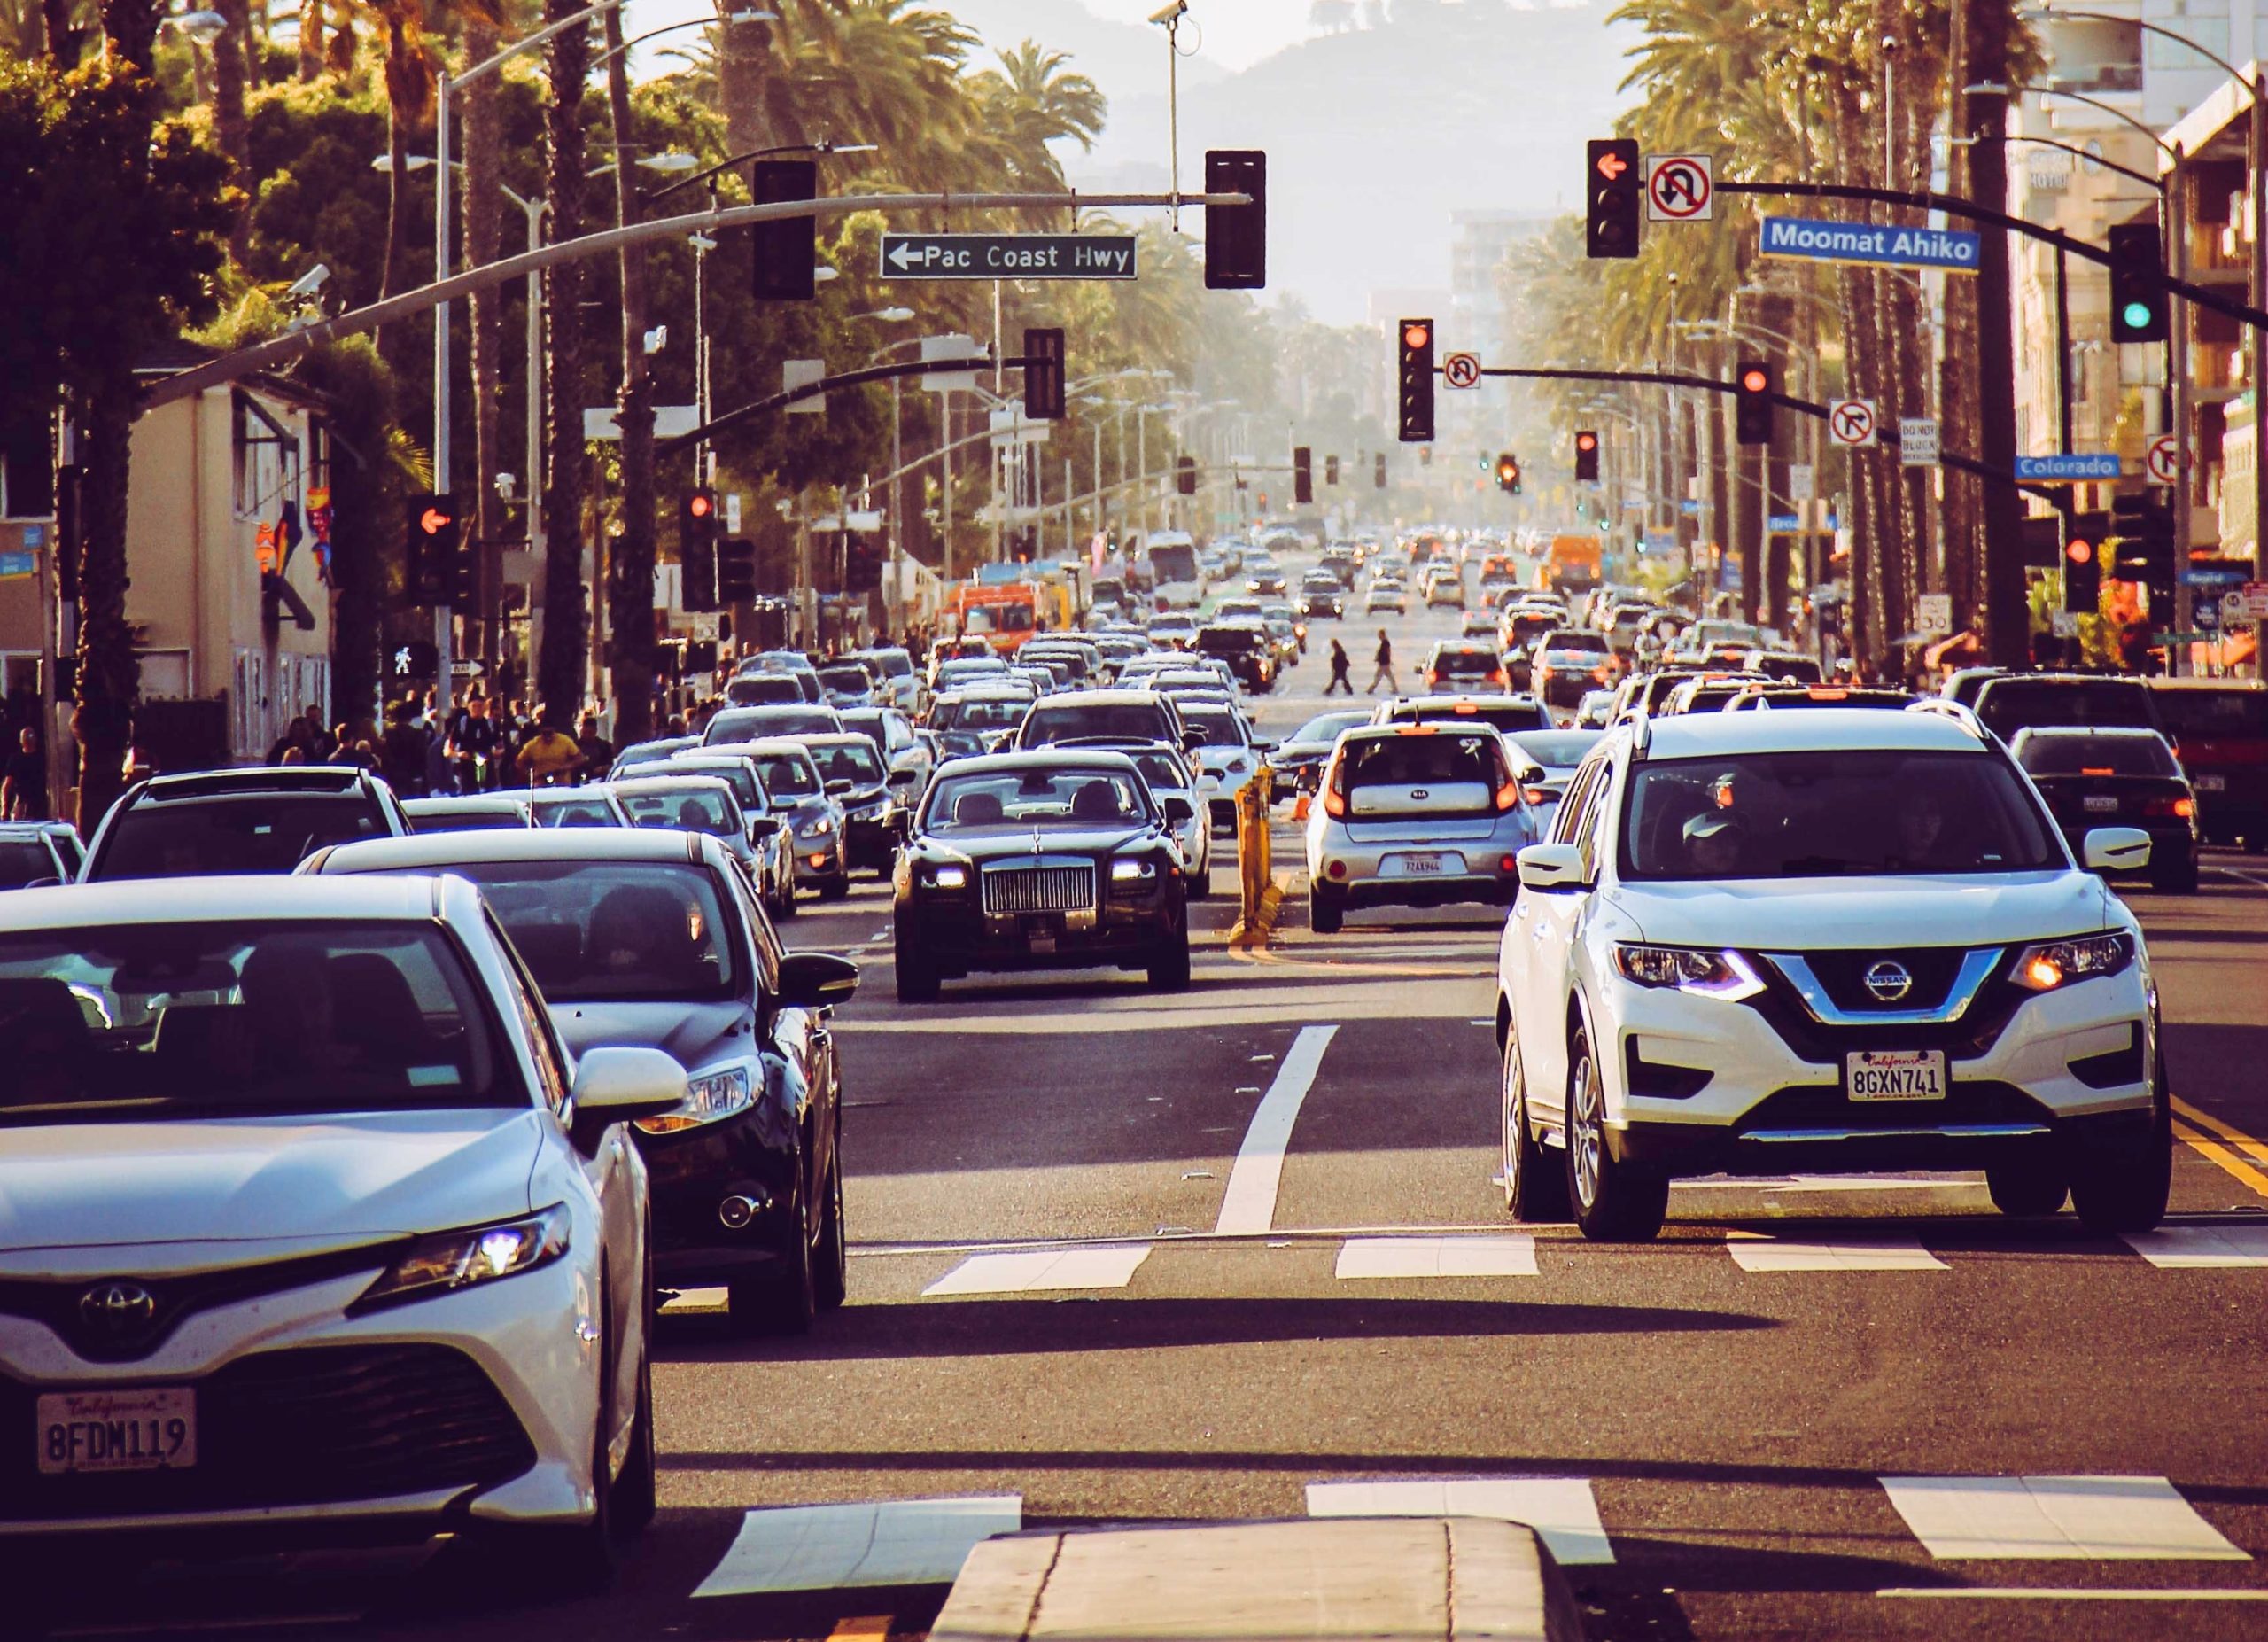
With many people working from home due to the pandemic, the Los Angeles area lost its long-held title as the nation’s most traffic-congested region in 2020 — falling to second place for the first time since at least 1982, according to an annual report released Tuesday.
According to the Texas A&M Transportation Institute’s 2021 Urban Mobility Report, the New York-Newark area overtook the Los Angeles-Long Beach-Anaheim region to claim the congestion title as defined by total hours of delay.
The report found that motorists in the New York-Newark areas spent a collected 494,268 hours stuck in traffic in 2020, well ahead of the 365,543 hours lost by Los Angeles-area drivers.
With COVID-19 stay-at-home orders in place for most of the year, and many Southland residents working from home, the amount of time lost to traffic congestion was dramatically down last year. By comparison, Los Angeles-area commuters in 2019 spent a collective 952,183 hours stuck in traffic.
According to this year’s report, the national average number of hours spent in traffic by a resident in a very large urban area was about 41 in 2020. People in Los Angeles-Long Beach-Anaheim spent about 46 hours in traffic last year, tying the region’s commuters with those in San Francisco-Oakland for fourth on the list of longest amount of time spent in traffic. Motorists in the New York-Newark area spent about 56 hours in traffic, followed by the Boston area at about 50 hours and Houston, where motorists lost 49 hours in traffic, according to the report.
The number is a significant drop from previous years. In 2019, 2018 and 2017, commuters in the Los Angeles-Long Beach-Anaheim area spent an average of about 119 hours per year, which was estimated to translate to an economic loss of more than $2,000 per person. In 2020, the estimated cost per commuter was about $1,142. The amount is based on factors such as the value of people’s time and the cost of gasoline wasted while in traffic.
The 2021 Urban Mobility Report was the second year the institute tracked annual greenhouse gases produced. For the Los Angeles-Long Beach-Anaheim area in 2020, vehicles produced an estimated 16.36 million tons of greenhouse gases, less than half what was produced in 2019, when 42.6 million tons were produced. Excess congestion is believed to be responsible for more than 1.33 million tons of greenhouse gas produced in the Los Angeles-Long Beach-Anaheim area in 2020 and 3.46 million tons produced in 2019.
Nationally, the COVID-19 pandemic cut traffic delays to levels not seen since 1991, but the light traffic only lasted from March through May. Starting in June and through August, rush hours reappeared, and by September, traffic delays were increasing to levels seen before the pandemic, according to the pandemic.
The study was funded by the Texas Department of Transportation and the National Institute for Congestion Reduction. People can explore the report at mobility.tamu.edu/umr.


